FIG. 12.

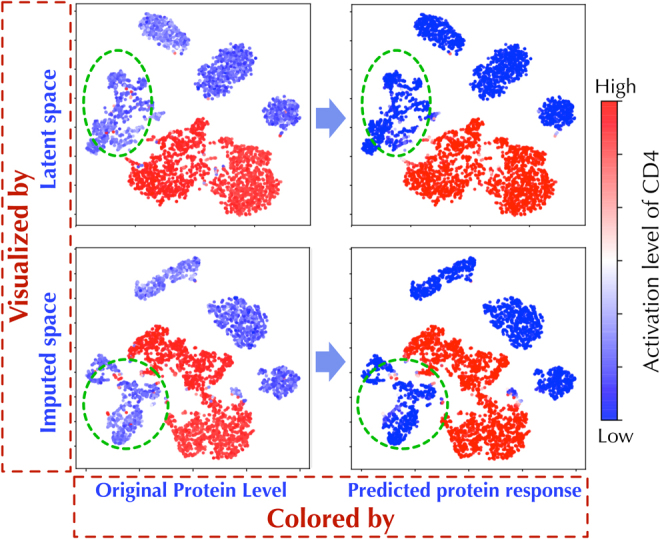
Both latent space and imputed space are transformed into 2D scatter visualization using t-SNE. The two figures in the left column are colored by the “ground truth” protein and the right column is colored by the predicted protein level.

Both latent space and imputed space are transformed into 2D scatter visualization using t-SNE. The two figures in the left column are colored by the “ground truth” protein and the right column is colored by the predicted protein level.