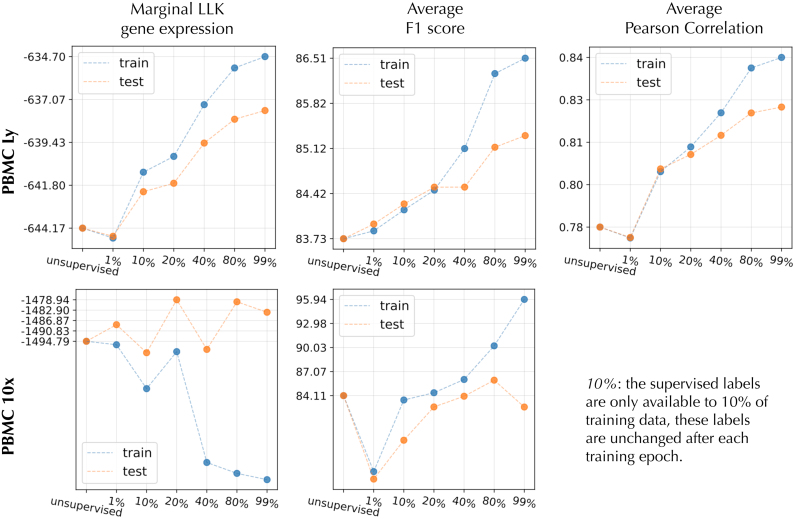
FIG. 13.
The performance on two data sets (PBMC Ly and PBMC 10x) is shown for different amount of labels utilized in training. The X-axis represents seven systems with an increasing amount of labeled data available for the semisupervised objective (Note: no marker gene/protein pair is available for PBMC 10x). We measured three different metrics: the marginal log-likelihood, average F1 of protein/cell-type classifier in the latent space, and average correlation between marker gene and the protein.

