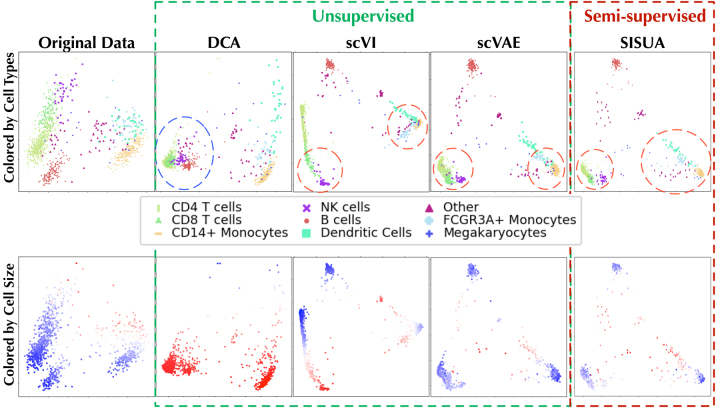
FIG. 7.
A PCA model trained using original gene expression (the data before corruption) of the PBMC 10x data set was used to project the denoised gene expression from different models into its space. The top row is colored by cell type, and the bottom row by denoised cell size (red color indicates large, white color midrange, and blue small cell size).

