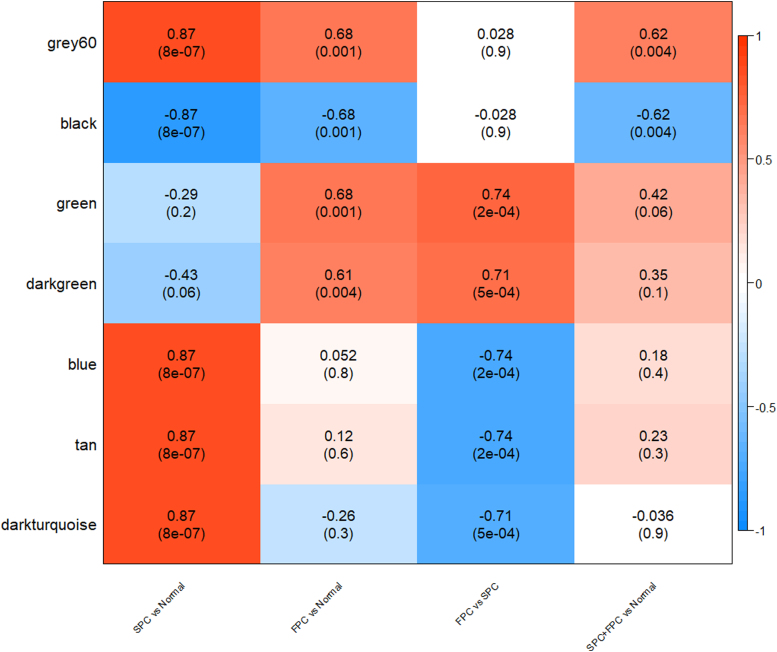
FIG. 2.
Correlation coefficient and p-value (in parenthesis) for the association of major gene modules represented by a module eigengene in each row indicated in the left with one clinical feature in each column indicated in the bottom. The color bar to the right indicates magnitude and direction of correlation. The deeper the red or blue, the higher the positive or negative correlation between the module eigengene and a clinical feature.

