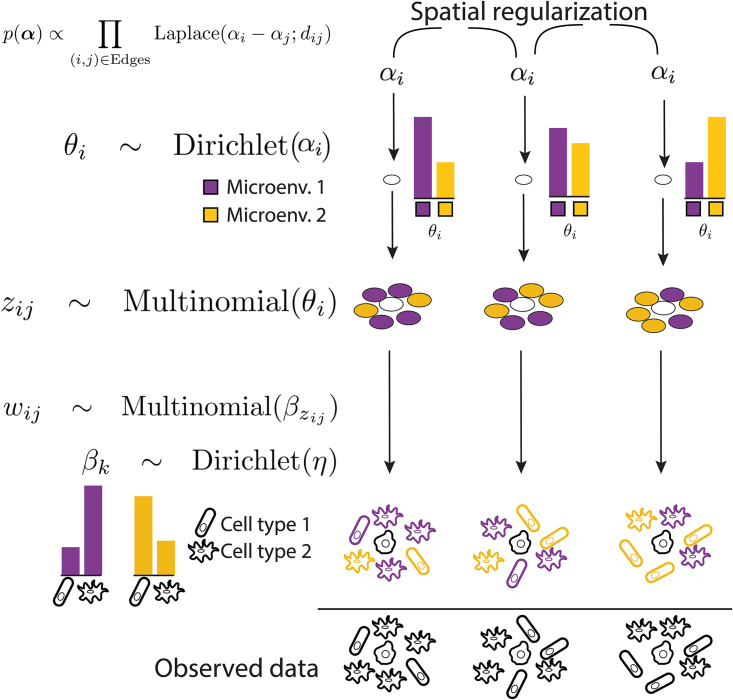
FIG. 2.
We introduce a model that ties together inferred microenvironments of nearby cells, thereby boosting the power to detect subtle microenvironmental changes. This assumption is encoded in similarity of as—previous preference for microenvironment. We anchor microenvironment to a cell shown in white. We consider two topics, purple and yellow. A particular neighborhood is a mixture of cells drawn from the two microenvironments. Variable z indicates whether a particular cell in the neighborhood was drawn from purple or yellow topic. w, a cell's phenotype (rod or flagellate), is drawn according to microenvironment's preference (e.g., purple microenvironment prefers flagellate). The observed information is only the shape (rod or flagellate), a cellular phenotype readout available from markers.

