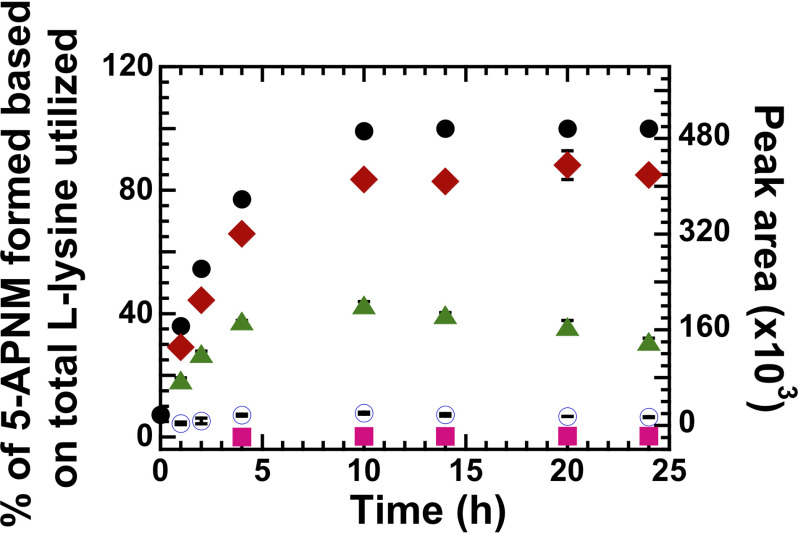
Figure 2.
Multiple-turnover reactions of l-LOX/MOG with l-lysine. Percentages of l-lysine utilization and product formation were plotted versus reaction times for up to 24 h. At 24 h, filled black circles represent utilization of l-lysine (up to 100%). Filled red diamonds represent formation of 5-APNM (up to 85%). Filled green triangles represent peak area of DΚΗ formation. Empty blue circles represent the peak area of KH, and filled pink squares represent peak area of 5-APNA acid formation (up to 0.32%). The error bars are SD.

