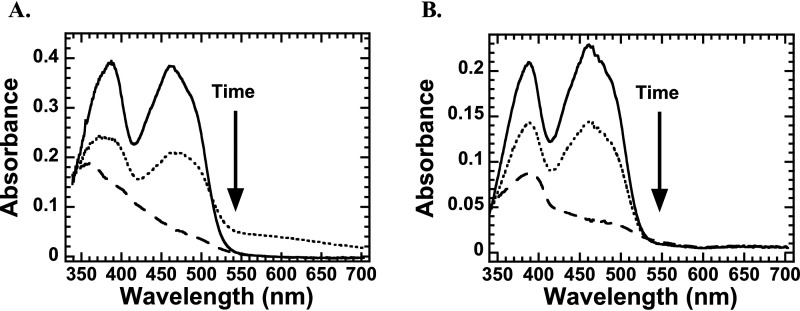
Figure 8.
Spectra of flavin reduction during the reaction of l-LOX/MOG with l-lysine (A) and l-ornithine (B). Shown are spectra of the enzyme-bound oxidized FAD (solid line), the reduced flavin (dashed line), and the species detected midway through the reduction, which indicates formation of a charge transfer species in the case of the l-lysine reaction (dotted line).

