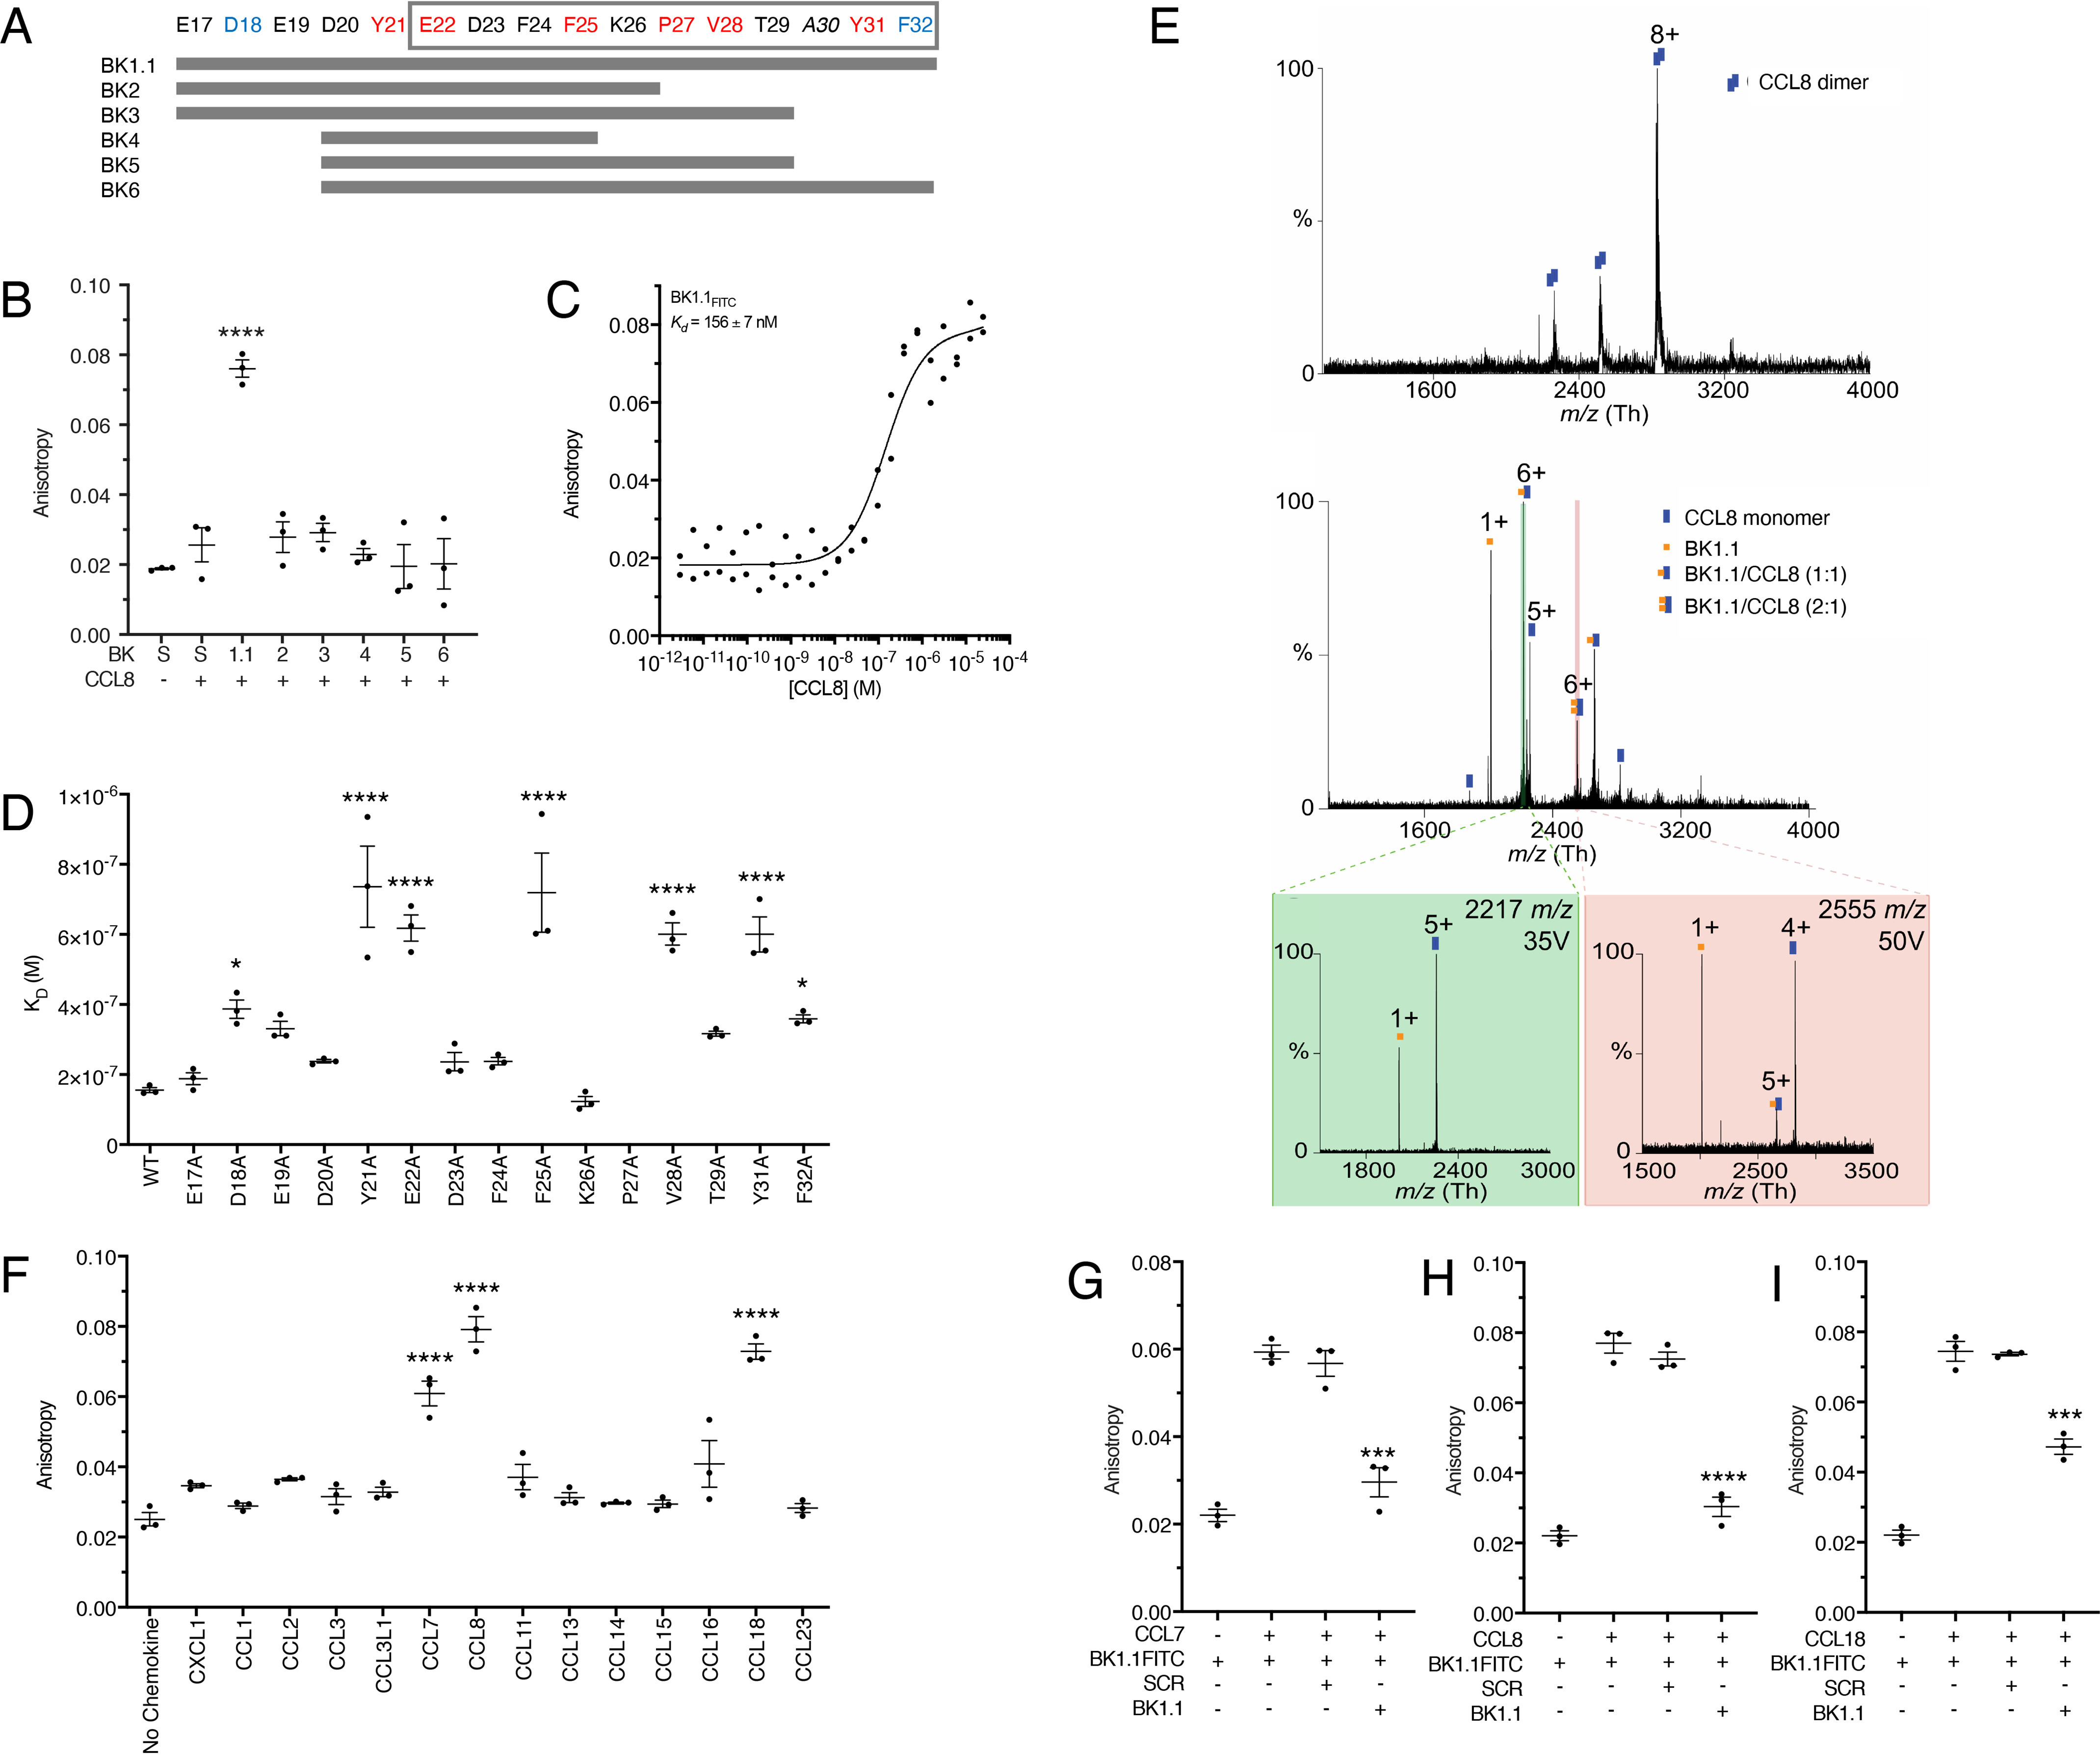
Figure 3.

Development and biophysical analysis of P672-derived peptides. A, design of a P672 peptide tiling array to identify CCL8-binding peptides. Positions of each residue within P672 are indicated, and the gray box indicates the CCL8-binding region identified by HDX-MS. P672 residues are colored according to CCL8-binding affinity from the Ala-scanning mutagenesis (see text and below). Red indicates either complete or highly significant loss of activity (p < 0.0001), and blue indicates moderately significant loss of activity (p < 0.05). Peptides synthesized (BK1.1–BK6) are indicated as gray bars. B, fluorescent peptides BK1.1–BK6 (50 nm) were incubated with CCL8 (1 μm), and the resulting anisotropy was determined. A scrambled peptide (S, SCRFITC) was used as a negative control. The anisotropy of each peptide after being incubated with CCL8 was compared with scrambled peptide using one-way ANOVA with Sidak's correction for multiple comparisons. ****, p ≤ 0.0001. C, fluorescent polarization assay to determine binding of BK1.1FITC to CCL8. The y axis shows anisotropy, and the x axis shows the dose of CCL8. Individual data points are indicated for one data set. The curve was fitted as described under “Experimental procedures” to calculate Kd. The mean Kd and S.E. values of three independent experiments are shown. D, fluorescent polarization assay to assess effect of alanine-scanning mutagenesis of BK1.1FITC on CCL8 binding. Kd values for each BK1.1FITC Ala mutant are shown as means ± S.E. of three biological replicates, which are individually indicated as points. The data for each mutant were compared with WT BK1.1, using a one-way ANOVA with Sidak's correction for multiple comparisons. ****, p ≤ 0.0001; *, p ≤ 0.05. The mutant P27A showed no detectable binding. E, MS to assess effect of BK1.1 on CCL8. Top panel, native MS of CCL8 homodimer. Middle panel, in-solution dissociation of CCL8 dimer and further binding of CCL8 to one and two BK-1. Confirmation of CCL8/BK-1 complex by HCD gas-phase dissociation of isolated precursor ions is shown in the bottom panel: left panel, 2217 m/z corresponding to CCL8/BK1.1 (1:1); and right panel 2555 m/z corresponding to CCL8/BK1.1 (1:2). Buffers contained up to 0.5% DMSO. All analyses were performed in triplicate. F, fluorescent polarization assay to assess the binding of BK1.1FITC against a CC-chemokine panel. The data are presented as means ± S.E. of three biological replicates, which are individually indicated as points. Each biological replicate was performed as technical duplicate. CXCL1 was used as a negative control. CC-chemokine binding compared with the negative control using a one-way ANOVA with Sidak's correction for multiple comparisons. ****, p ≤ 0.0001; *, p < 0.05. G–I, fluorescence polarization competition assay for BK1.1FITC and CC-chemokine interactions. BK1.1FITC (50 nm) was incubated with the indicated chemokine (1 μm) with or without unlabeled BK1.1 or SCR (BK1.1 scrambled) peptides (50 μm) for 30 min, and the resulting anisotropy was measured. The data are presented as means ± S.E. of three biological replicates, which are individually indicated as points. Each biological replicate was performed as technical duplicate. Statistical significance of differences (SCR versus BK1.1) were calculated using a one-way ANOVA. ****, p ≤ 0.0001; ***, p ≤ 0.001.
