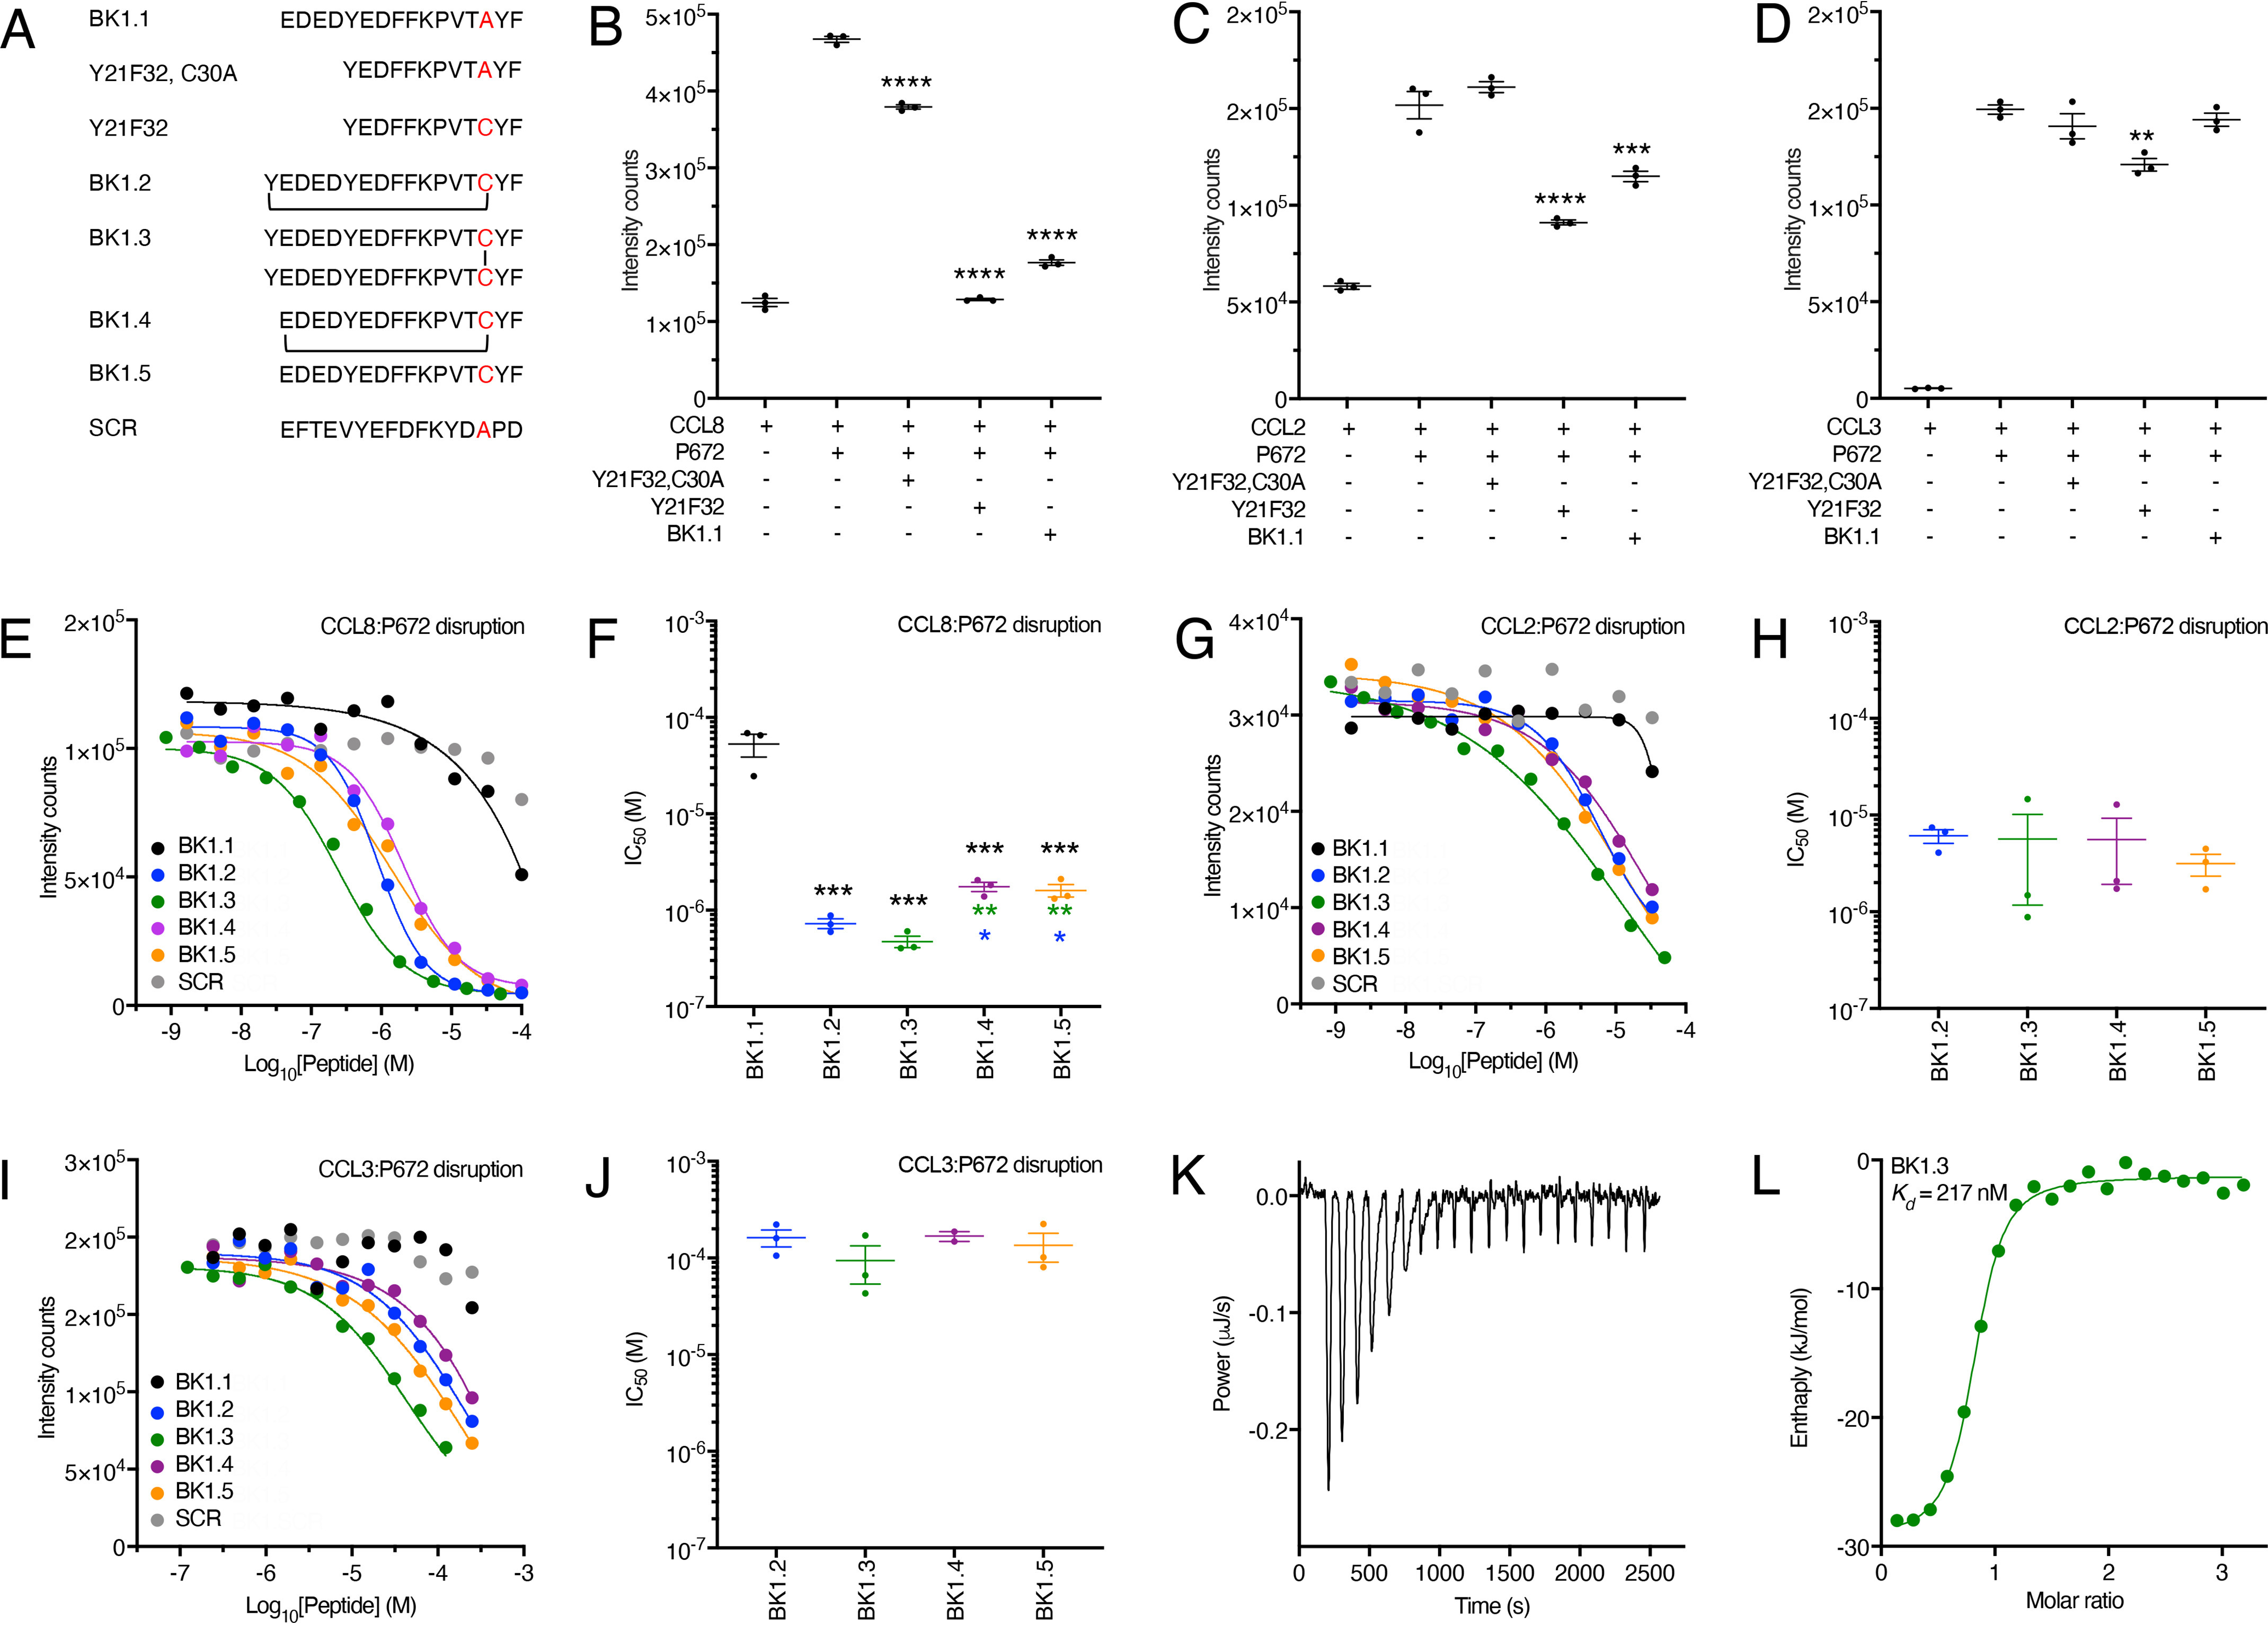
Figure 4.

Development and biophysical analysis of the BK1.1 peptide series. A, sequences of peptides studied with disulfide bond (BK1.3) or thioether cyclization (BK1.2 and BK1.4) indicated by lines. SCR is a scrambled peptide based on the sequence of BK1.1. B–D, effect of indicated peptides at a concentration of 100 μm on a His-tagged P672-biotinylated CCL8, CCL2, or CCL3 interaction, respectively, using an AlphaScreen assay. In each panel, the y axis shows intensity counts, and the x axis shows the peptide. The data are presented as means ± S.E. of three independent experiments, shown as individual data points. Statistically significant differences (compared with chemokine + P672) using a one-way ANOVA with Sidak's multiple comparisons test are indicated by asterisks: ****, p ≤ 0.0001; ***, p ≤ 0.001; **, p ≤ 0.01. E, G, and I, representative dose-response AlphaScreen assay curves showing disruption of His-tagged P672 interactions with biotinylated human CCL8, CCL2, and CCL3, respectively, by each member of the BK1.1-derived series. The y axis shows intensity counts, and the x axis the peptide concentration (Log10 molar). The data are shown as means of two technical replicates. The curves were fitted with four parameters to estimate IC50. F, H, and J, summary IC50 values for inhibition of His-tagged P672 binding to human CCL8, CCL2, and CCL3, respectively, by each member of the BK1.1-derived series, where these could be calculated. The y axis shows IC50 (m). The data are presented as the means ± S.E. of three independent experiments, each shown as individual data points. Each independent experiment was conducted as two technical replicates. Summary IC50 values and Hill slopes are provided in Table S3. Statistically significant differences (compared with BK1.1), using a one-way ANOVA with Sidak's multiple comparisons test, are indicated by black asterisks. Statistically significant differences (pairwise comparisons of BK1.2, BK1.3, BK1.4, and BK1.5) using one-way ANOVA with Tukey's multiple comparisons test are indicated with blue asterisks (comparisons with BK1.2) or green asterisks (comparisons to BK1.3). ***, p ≤ 0.001; **, p ≤ 0.01; *, p ≤ 0.05. K, isothermal calorimetry measurements of BK1.3 binding to CCL8. The y axis shows the thermal power applied during sequential injections of BK1.3 to maintain constant temperature, and the x axis shows the time. L, binding isotherm of BK1.3 binding to CCL8. Each point represents a single injection. Binding enthalpy (kJ/mol) is shown on the y axis, and the molar ratio of BK1.3 to CCL8 is shown on the x axis. An independent single-site model (green line) was fitted to the data. The calculated thermodynamic binding parameters (± 95% confidence interval) are Kd = 217 ± 83 nm, stoichiometry n = 0.776 ± 0.024, enthalpy ΔH= −28.12 ± 1.587 kJ/mol, and entropy ΔS = 33.26 J/mol/K. Values for the blank model were 0.309 ± 0.109 ΔJ.
