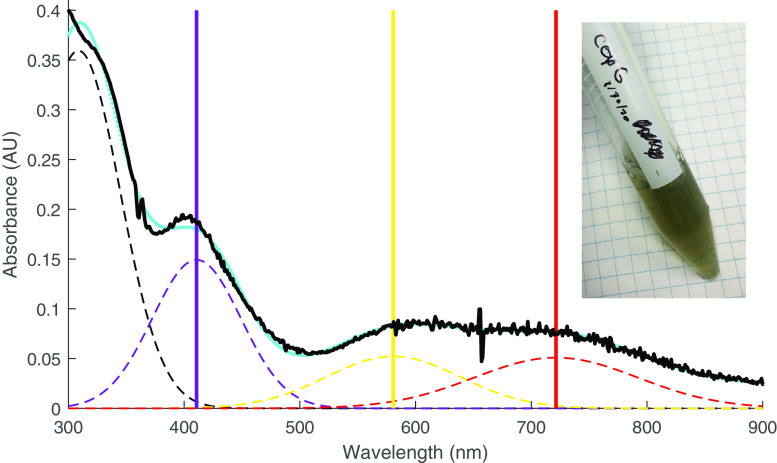
Figure 4.
Absorption spectrum of CopG. Spectrum of CopG (purified from medium containing supplemental copper) under aerobic conditions. The absorbance data (black) are fitted with a sum of gaussian functions (cyan). The spectrum can be approximated by three main peaks (dashed lines) in the visible range centered at 411 nm (violet), 581 nm (yellow), and 721 nm (red) in addition to the near-UV absorbance from aromatic side chains. For fitting purposes, these maxima are each treated as single peaks (but see the text). The inset shows the visual appearance of the purified CopG protein solution.

