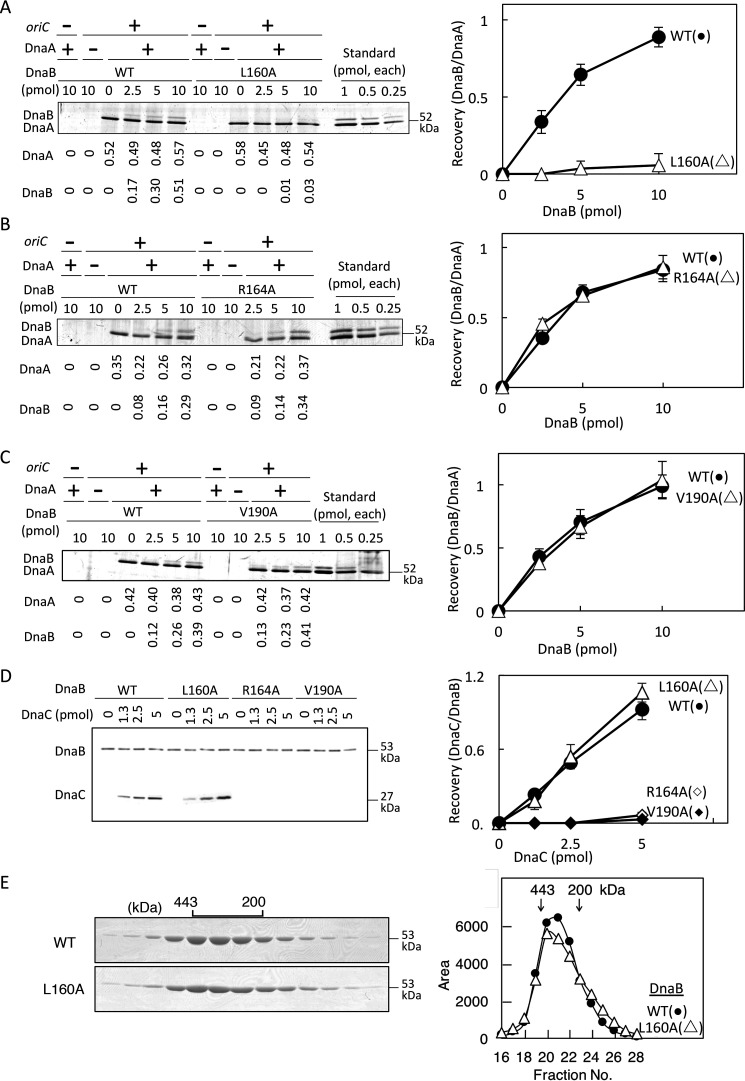
Figure 3.
DnaA and DnaC binding activities of DnaB. A–C, oriC pulldown assay for analysis of DnaA binding. Bio-oriC (0.1 pmol, 10 nm) was incubated on ice for 10 min with (+) or without (–) DnaA (5 pmol, 500 nm) and the indicated amounts (0–10 pmol or 1.0 μm, as monomer) of His-DnaB (WT or the indicated mutant), and bound materials were recovered with streptavidin-coated beads. Recovered DnaA and His-DnaB were analyzed by SDS-PAGE and silver staining (left panels). The recovered amounts (pmol, as monomers) were deduced using quantitative standards and are shown below the gel image. Quantitative standards included the same amounts (indicated as monomers) of each DnaA and His-DnaB (Standard). Based on these results, ratios of DnaB (as monomers) and DnaA were calculated (right panels). Experiments were performed in duplicate, and representative gel images and means ± S.D. (error bars) are shown. D, DnaC-binding activity of DnaB was analyzed by pulldown assay. His-DnaB (5 pmol, 500 nm, as monomer) was incubated on ice for 10 min with DnaC (0–5 pmol), and His-DnaB and bound materials were collected with Co2+-conjugated magnetic beads and analyzed by SDS-PAGE and silver staining (left). The numbers of recovered DnaB and DnaC molecules were deduced using quantitative standards, and ratios of DnaB (as monomers) and DnaC were calculated (right). E, gel filtration analysis was performed. His-DnaB (WT or L160A) (20 µg) was analyzed using a Superose 6 gel filtration column. Eluted fractions (5 μl) were analyzed by SDS-PAGE and Coomassie Brilliant Blue staining (left). Elution positions of marker proteins are indicated (443 and 200 kDa). Intensities of the DnaB bands are plotted (right).

