
Figure 1.
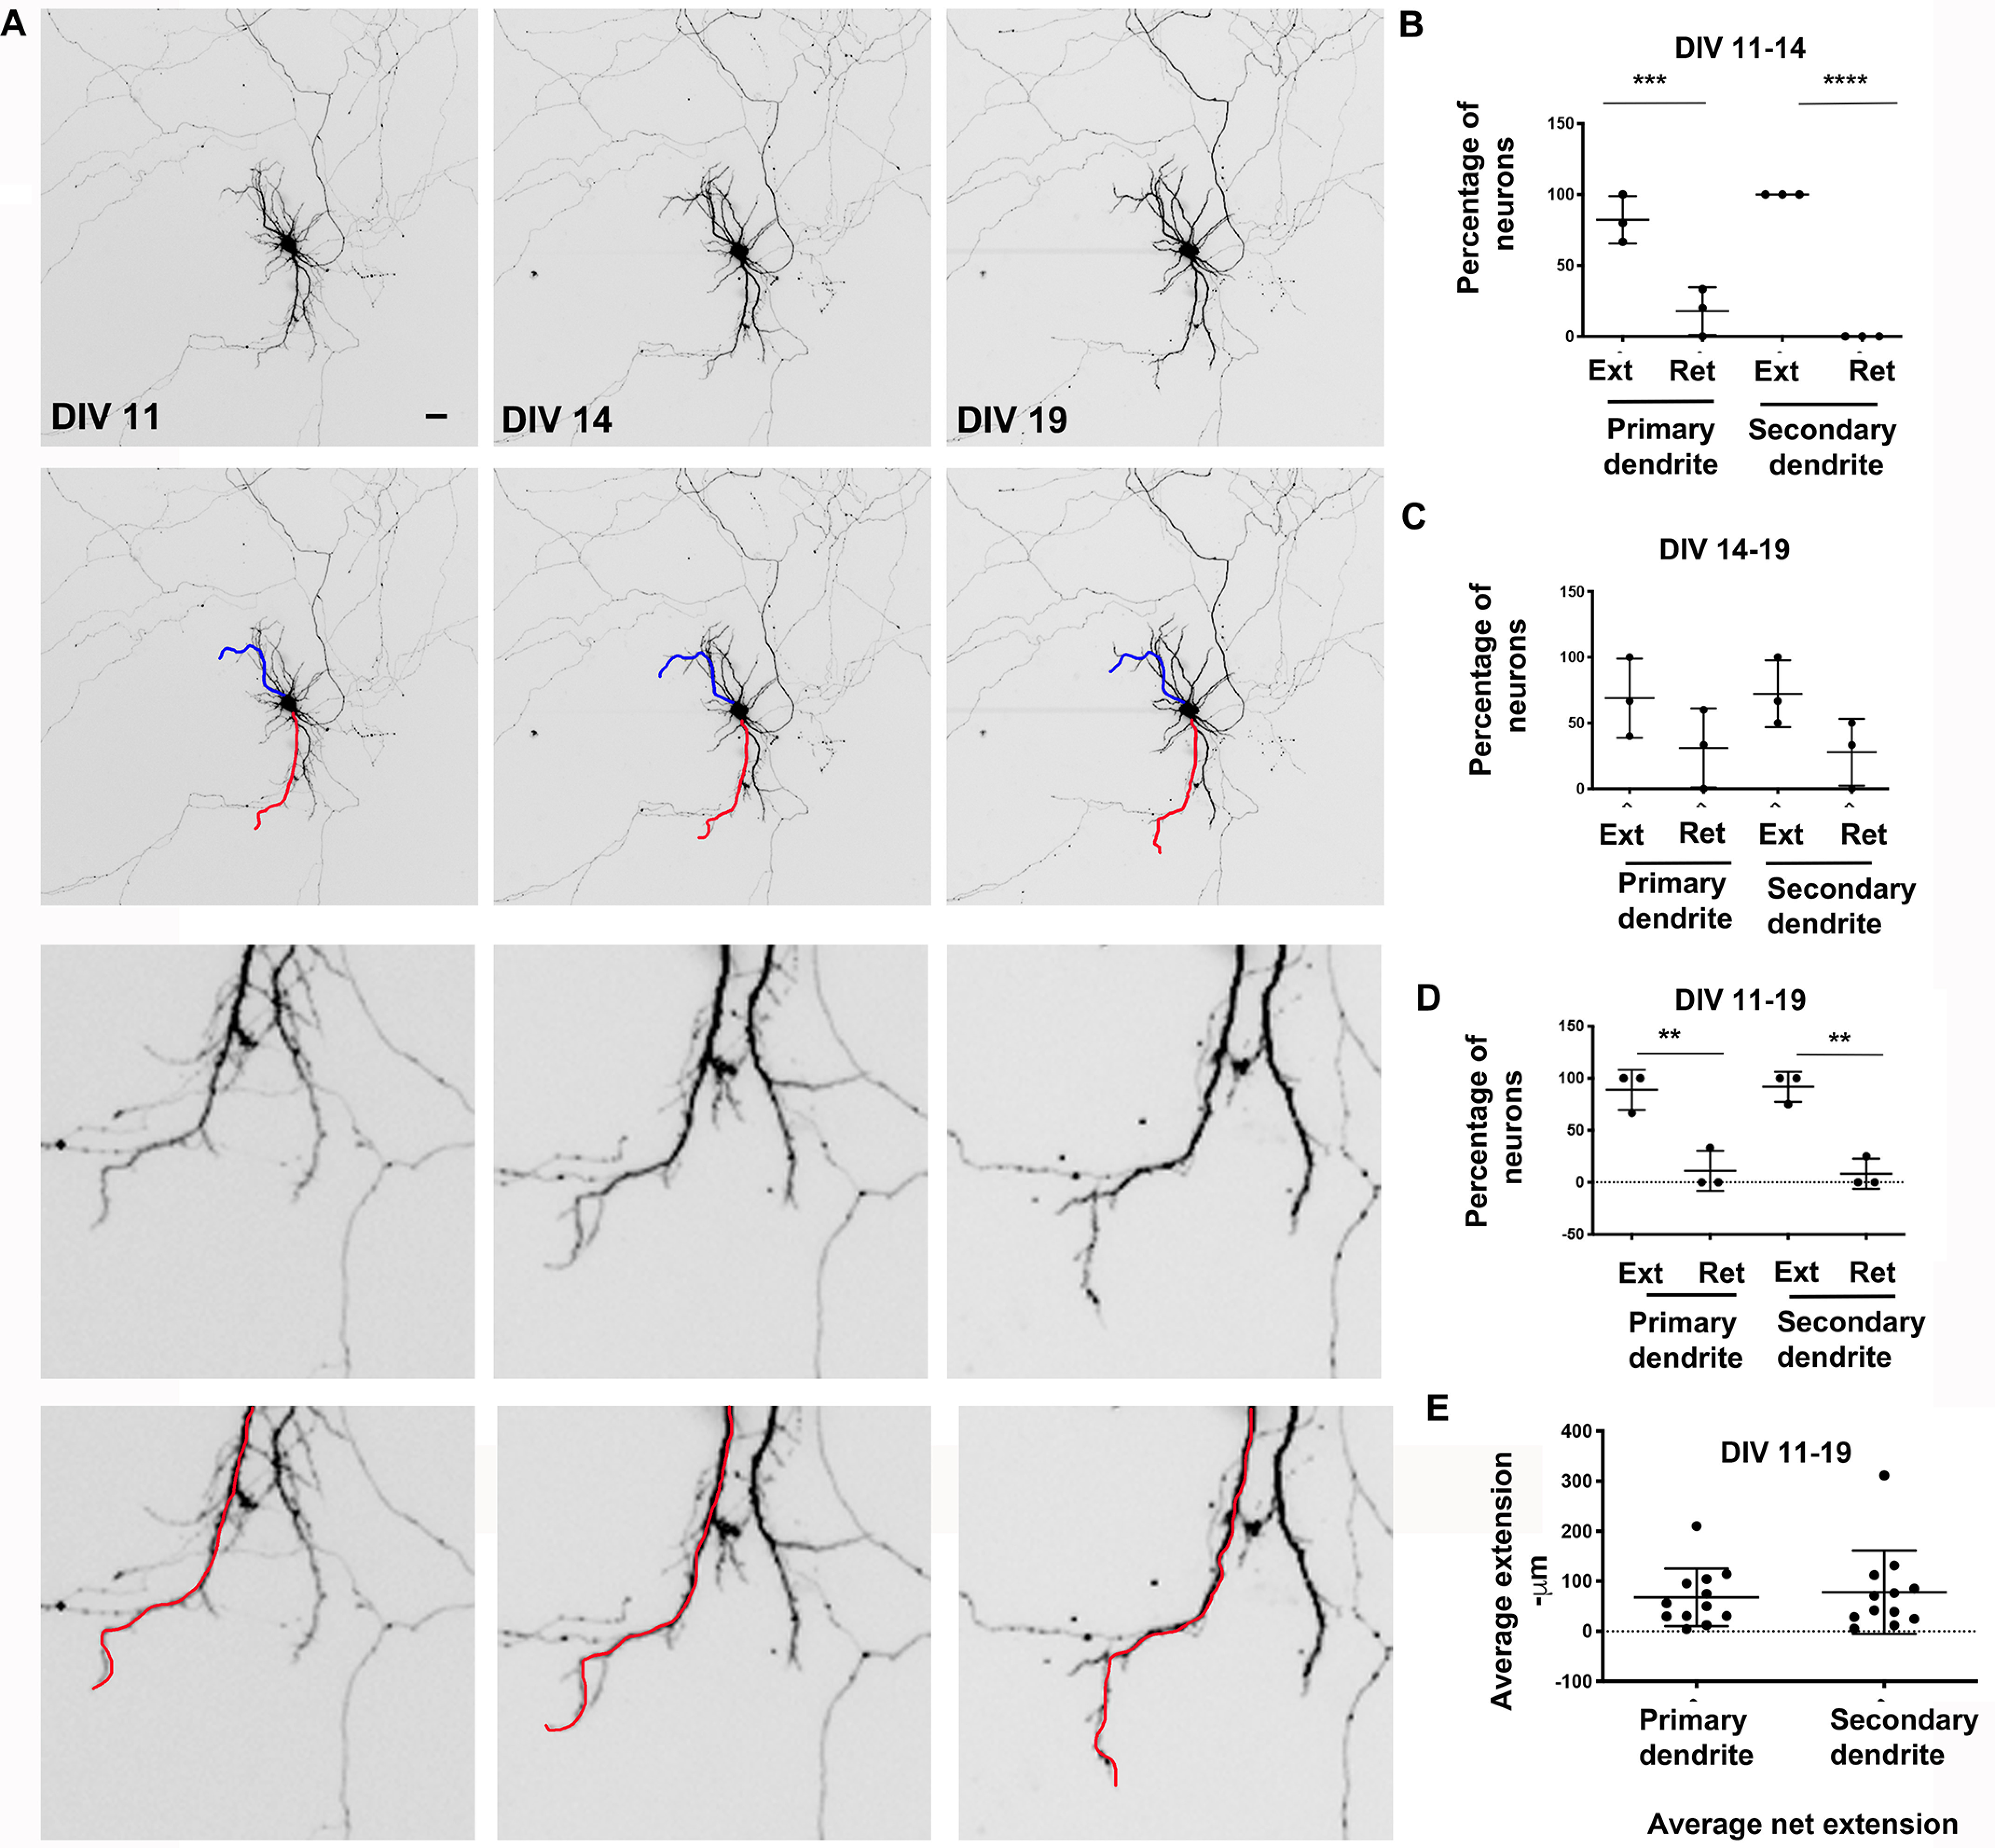
Dendrite dynamics during development in hippocampal neurons. A, representative images from time lapse imaging of rat hippocampal primary neurons in culture at the indicated time points. The red and blue lines overlay the primary and secondary dendrites, respectively. Bottom panels, magnified regions of the top panels. Scale bar, 12.5 μm. B, percentage of neurons with extension or retraction of primary and secondary dendrites (DIV 11–14). C, percentage of neurons with extension or retraction of primary and secondary dendrites (DIV 14–19). D, percentage of neurons with extension or retraction of primary and secondary dendrites (DIV 11–19). Data analysis by one-way ANOVA with Tukey's multiple-comparison test for B–D. *, p < 0.05; **, p < 0.005; ***, p < 0.0005. Data represent mean ± S.D. (error bars). E, average extension in microns of primary and secondary dendrites (DIV 11–19). Data analysis by unpaired t test assuming equal variances. *, p < 0.05; **, p < 0.005; ***, p < 0.0005 for C and D. Data represent mean ± S.D.