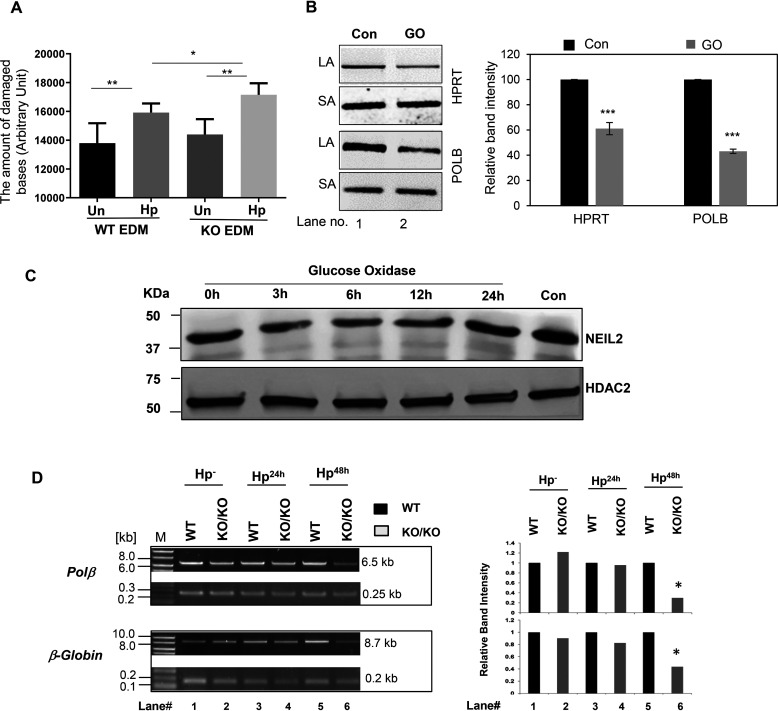
Figure 6.
Evaluation of the role of NEIL2 in H. pylori infection-induced accumulation of oxidized DNA bases in stomach epithelial cells. A, the stomach epithelial EDM of WT and Neil2 KO mice were either untreated or infected with H. pylori for 48 h. The supernatant at each condition was used to measure the oxidative damage of DNA as mentioned in Materials and methods. B, AGS cells were either untreated or treated with glucose oxidase (GO) for 45 min. The genomic DNA was used for long amplicon (LA) and short amplicon (SA) qPCR for HPRT and POLB. The histogram represents the accumulation of oxidative DNA base lesions after densitometry from 3 independent sets of experiment. One representative gel figure is shown. The band intensity in the control cell was arbitrarily set as 100. The error bars represent the standard deviation of the mean band intensity. ***, p < 0.001. C, the NEIL2 expression level was measured by Western blotting from nuclear extract of AGS cells following GO treatment for the indicated time. Con, untreated control. HDAC2, histone deacetylase 2, used as a nuclear loading control. D, stomach epithelial enteroids of WT and Neil2 KO mice were either mock infected or infected with H. pylori for 24 h, 48 h, or 72 h and then harvested for genomic DNA isolation. LA-qPCR was performed to evaluate the level of oxidized DNA base lesions after H. pylori infection. Representative gels show the amplification of each long fragment (∼7-8 kB) (upper) normalized to that of a short fragment (∼250 bp) (lower) of the corresponding (Pol β and β-Globin) genes. The histogram represents the accumulation of oxidative DNA base lesions after densitometry from 4 different sets of WT versus Neil2 KO mice. The band intensity in the WT mice was arbitrarily set as unity (n = 1). The error bars represent the standard deviation from the mean band intensity.

