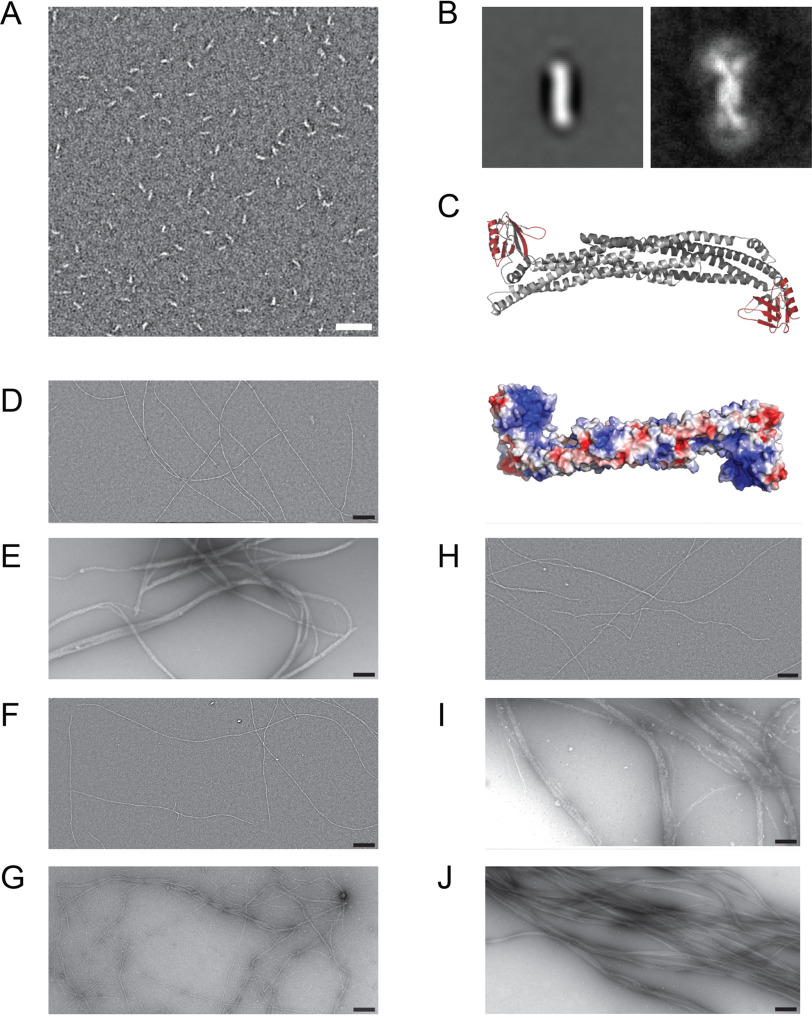
Figure 2.
Electron micrographs of ASAP1BARPH and reconstituted F-actin:ASAP1 fragment complexes. A, EM micrograph of 100 nm ASAP1BARPH. Scale bar, 50 nm. B, Global average (left) and variance (right) images of ASAP1BARPH showing the curved structure of the tandem dimer and the flexibility of the PH domain at both ends of the molecule. The PH domain is not seen in the global average due to its variable position relative to the N-BAR domain. In the variance image, the position of the PH domain can be seen as a white arc (high variability) at each end of the molecule. Window size 36.8 nm by 36.8 nm. In the most extended conformation, the molecule is 4–5 nm wide and 26–27 nm long. C, top, homology model of ASAP1BARPH. The N-BAR domain dimer is colored gray and the PH domains are red. The long axis of the N-BAR domain is ∼14.4 nm long. Bottom, the ASAP1BARPH surface is colored according to the electrostatic potential distribution (red, −5 KbT/ec; blue, −5 KbT/ec). D–I, electron micrographs of 1000 nm F-actin (D) incubated with 1000 nm ASAP1BARPH (E), 1000 nm ASAP1PH (F), 1000 nm ASAP1FL (G), 1000 nm ASAP1PZA (H), 1000 nm ASAP1BARPZA (I), or 1000 nm VTail as a control (J). Scale bar, 200 nm.

