
Figure 5.
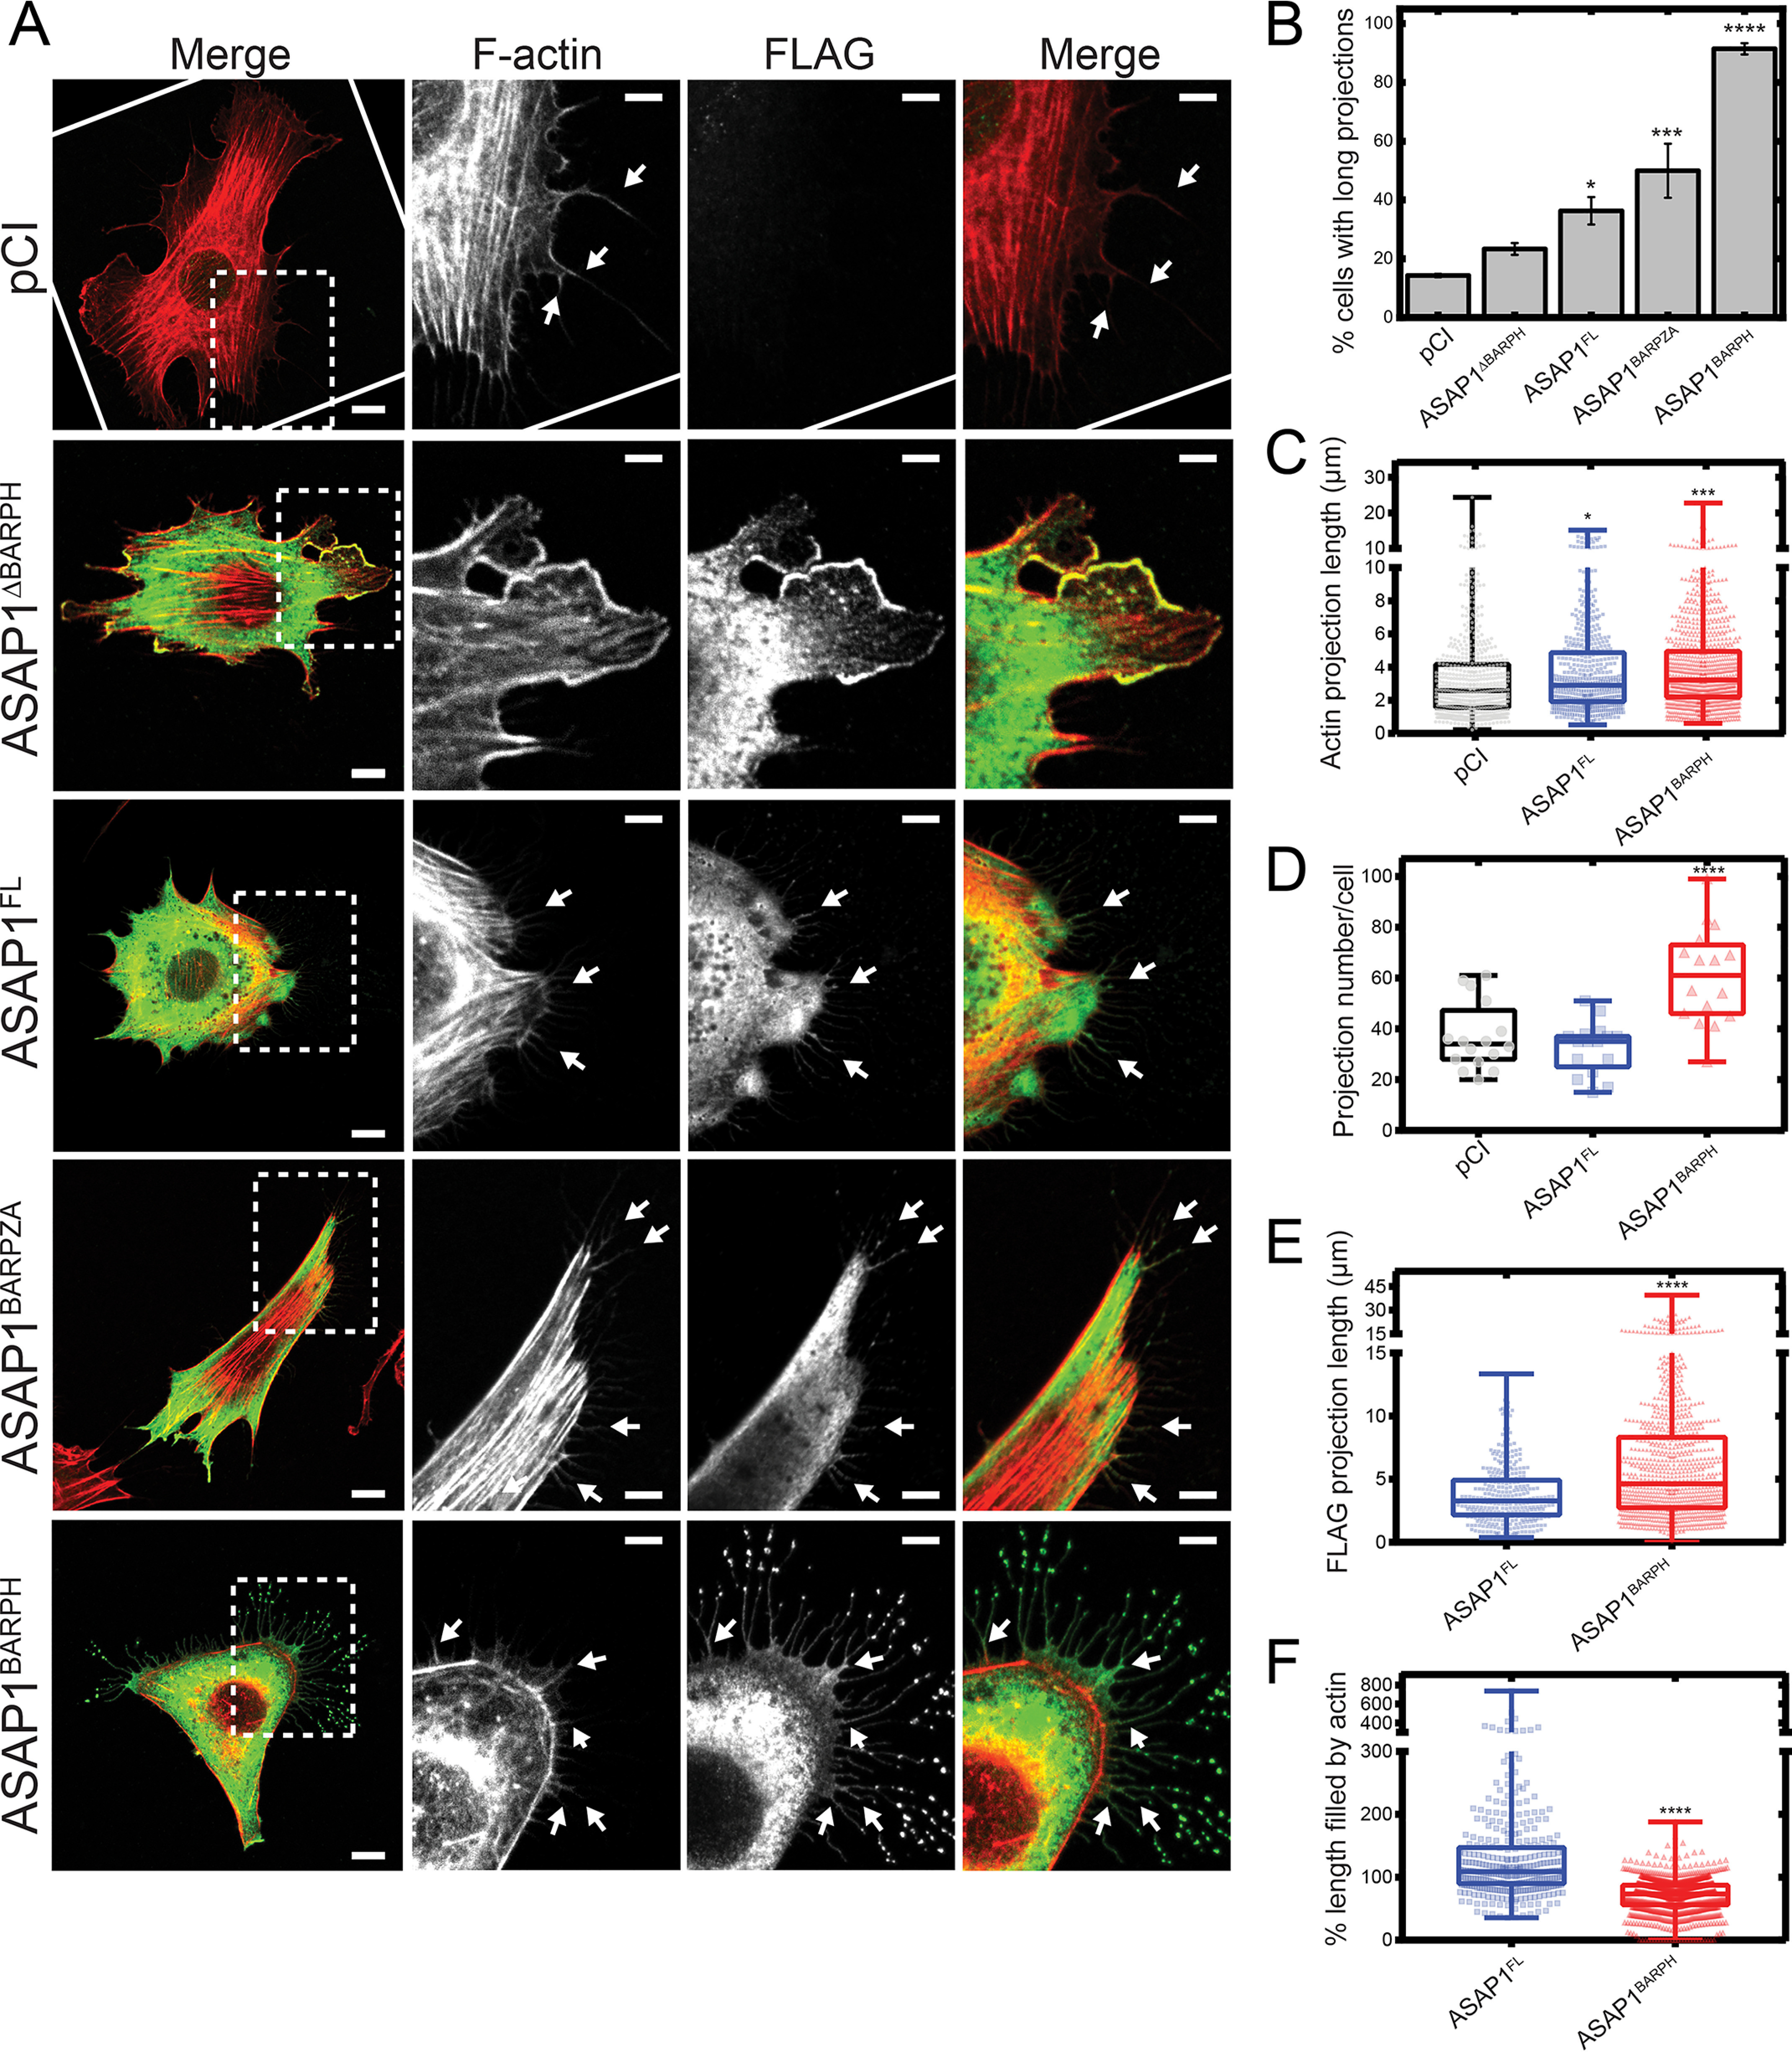
ASAP1BARPH induces the formation of cellular projections in NIH3T3 fibroblasts. Transient overexpression of ASAP1BARPH induces the formation of long projections on the surface of NIH3T3 fibroblasts. NIH3T3 fibroblasts were transfected with different Flag-tagged ASAP1 constructs and costained for F-actin and Flag-ASAP1 fragments using rhodamine-phalloidin and anti-Flag antibody, respectively. A, F-actin is shown in red and Flag-ASAP1 proteins in green in the merged images. Scale bars throughout represent 10 μm and 5 μm in whole-cell and inset images, respectively. White arrows indicate examples of actin-containing projections. B, quantification (mean ± S.E.M.) of cells with long projections (at least 10 actin projections of >5 μm) per ASAP1 construct from 3–4 experiments. An average of 60∼100 cells positive for Flag immunostaining for each construct was scored blindly for exhibiting long projections in each experiment. C, quantification of the projection length by F-actin staining (n = 589 [pCI], n = 522 [ASAP1FL], n = 967 [ASAP1BARPH]). D, quantification of the total numbers of actin projection of >0.2 μm in cells transfected with different ASAP1 constructs from 3 experiments (n = 16 [pCI], n = 16 [ASAP1FL], n = 16 [ASAP1BARPH]). E, Quantification of the projection length by anti-Flag immunostaining (n = 324 [ASAP1FL], n = 993 [ASAP1BARPH]). F, quantification of the percentage of projection length filled by actin (n = 324 [ASAP1FL], n = 993 [ASAP1BARPH]). Statistics are based on the indicated number of projections (n) from 16 cells and three experiments. Of note, ASAP1FL did not fill the entire length of the projections in ∼60% of the analyzed cases. This results in values of >100% for the projection length filled by actin. In contrast, ASAP1BARPH did not fill the entire length of the projections in ∼10% of the analyzed cases. ****, p < 0.0001, ***, p < 0.001, and *, p < 0.05, using one-way ANOVA with Dunnett's multiple-comparison test (B, C, and D) and Student's t test (E and F).