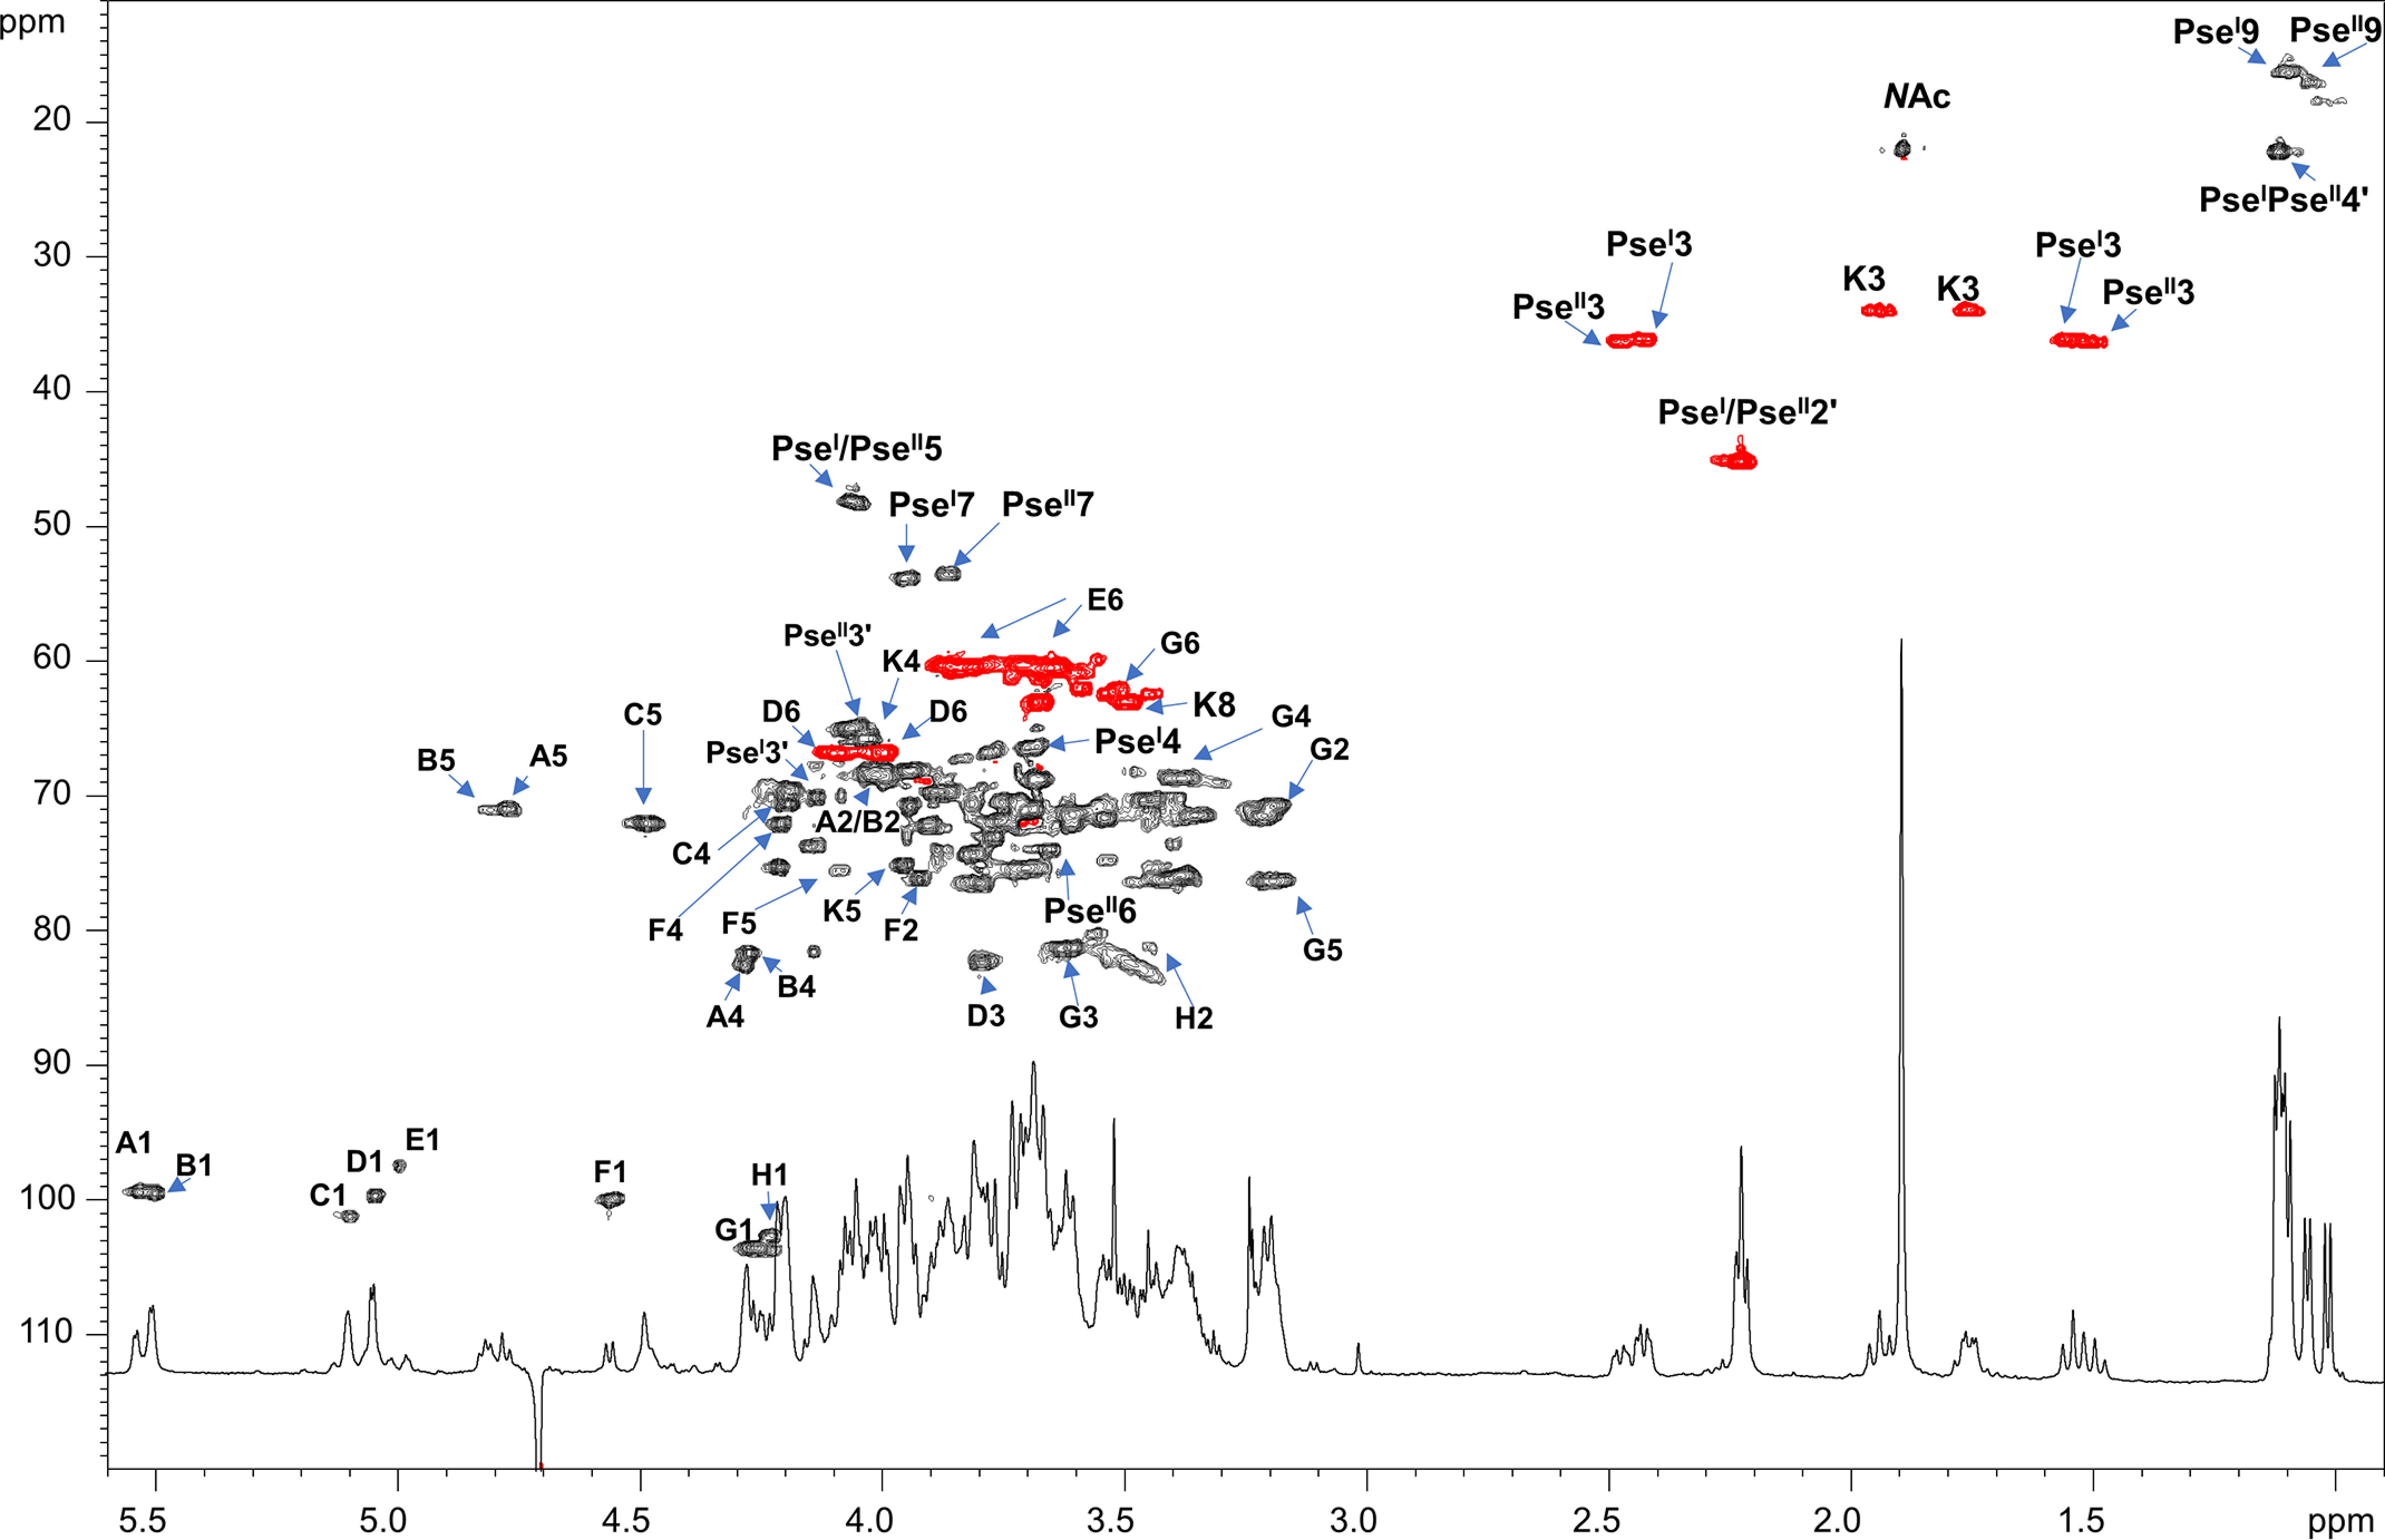
Figure 3.

Zoom of the 1H-13C HSQC spectrum of OS1rkpA product obtained after mild acid hydrolysis of the LPS from S. fredii HH103 rkpA. Most of the heteronuclear correlations are indicated. Spin system labels are indicated as described in Table 2. The color of the cross-peaks indicates the phase: black indicates CH and CH3 signals, whereas red indicates CH2 signals.
