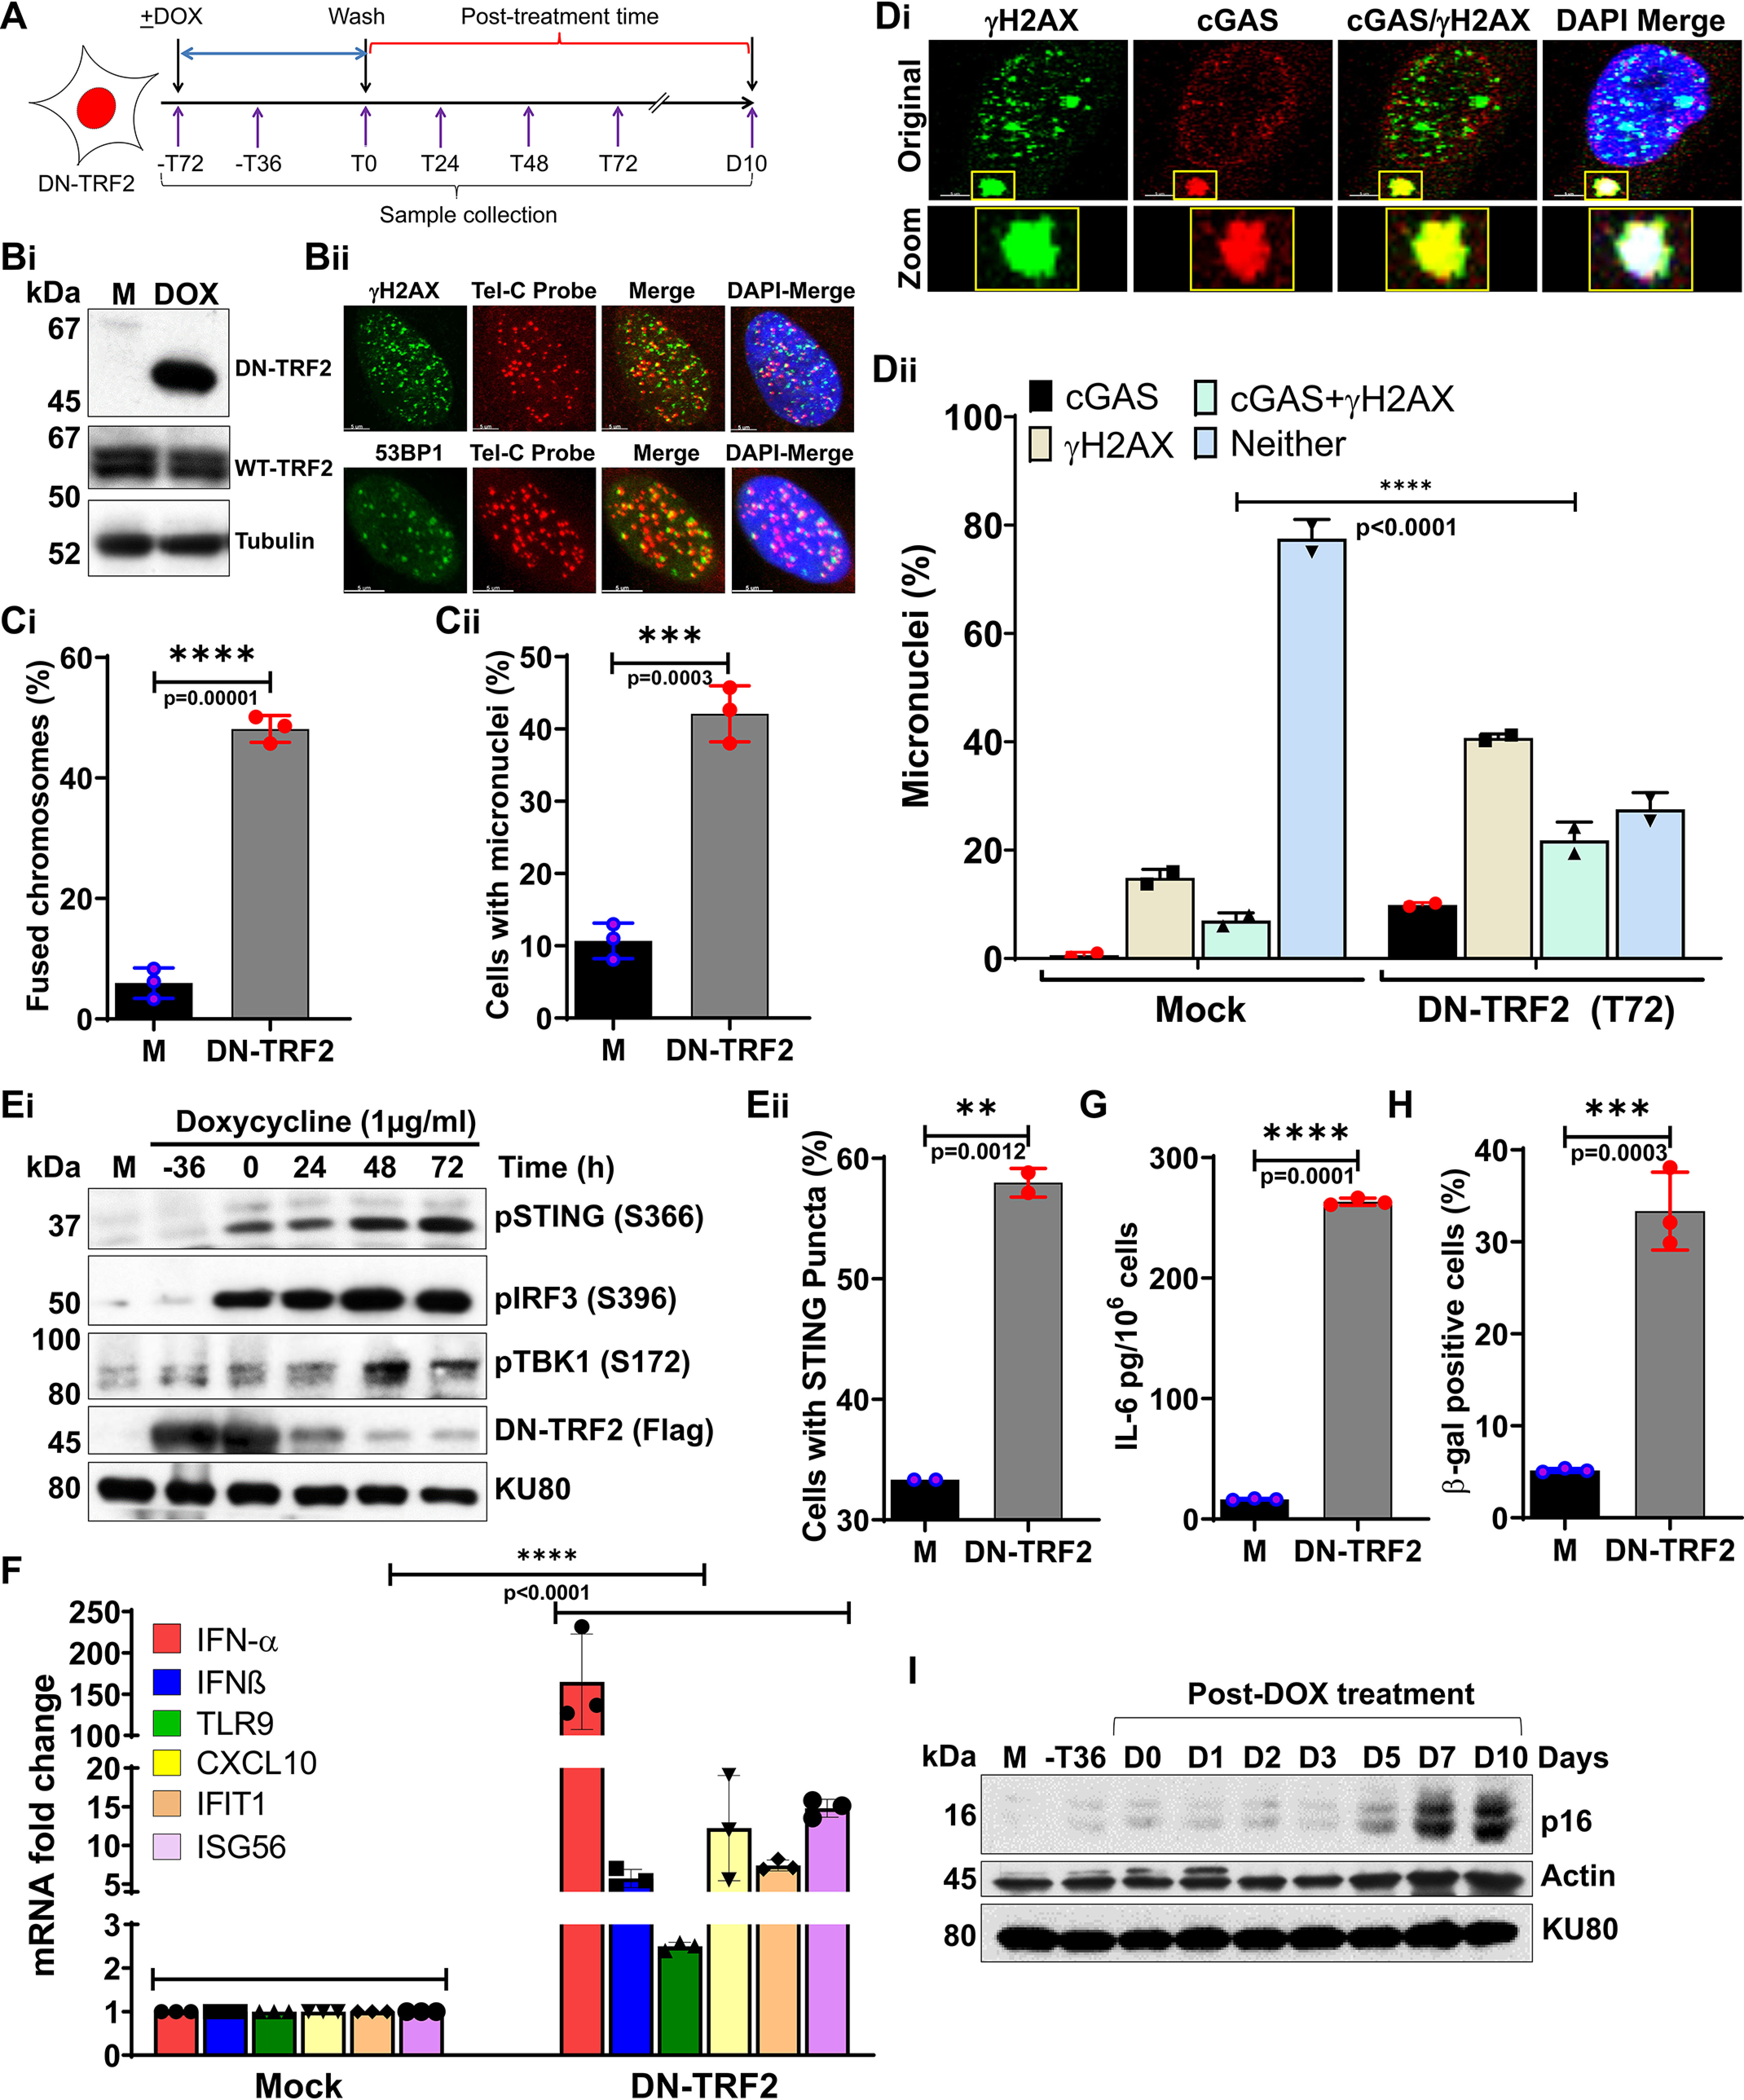
Figure 3.

Micronuclei produced in response to dysfunctional telomeres recruit cGAS and trigger cellular senescence. A, schematics of the experimental design used in panels B-I, illustrating treatment of HT1080 cells stably expressing DN TRF2 with 500 ng/ml of DOX for 72 h and the collection of samples at different post-DOX treatment times; T, hours, D, days. B, Western blotting shows expression of DN-TRF2 cells (i), and representative indirect immunostaining images show co-localization of γH2AX and 53BP1 with telomeric DNA probe (telC PNA probe; ii) at 72 h (T72) post-DOX treatment; M, mock. C, bar graphs show quantification of percentages of chromosome–chromosome fusions (i) and micronuclei (ii) in mock-treated and 72 h (T72) post-DOX treatment samples. Bar graph presents the mean ± S.D. from three independent experiments. D, representative images show co-localization of cGAS and γH2AX in micronuclei (i), and the graph shows quantification of percentage of cGAS, γH2AX, cGAS/γH2AX, and neither positive micronuclei (ii) in DN-TRF2–expressing cells treated with either mock treatment or DOX for 72 h (T0). E–G, Western blots show phosphorylation status of STING (S366), IRF3 (S396), and TBK1 (S172) at the indicated times during and after DOX treatment (E, i); the graph shows the percentage of micronuclei-positive cells with STING puncta at 72 h after DOX treatment (E, ii); the graph shows increased levels of mRNAs associated with immune signaling quantified by qRT-PCR at 48 h post-DOX (T48) treatment time (F); and the graph shows IL-6 levels in cell culture supernatant at 48 h post-DOX (T48) treatment (G). Bar graph presents the mean ± S.D. from three independent experiments. H and I, dysfunctional telomeres cause premature senescence. Bar graph shows frequency of β-gal–stained HT1080-DN-TRF2 cells at 10 days post ± DOX treatment time (H). Bar graph presents the mean ± S.D. from 10-15 fields from three independent experiments. Representative Western blots show p16 expression at the indicated times during DOX treatment and after DOX removal (I). Statistical analysis were performed using Student's t test (Ci, Cii, Eii, G, and H) and two-way ANOVA (Dii and F).
