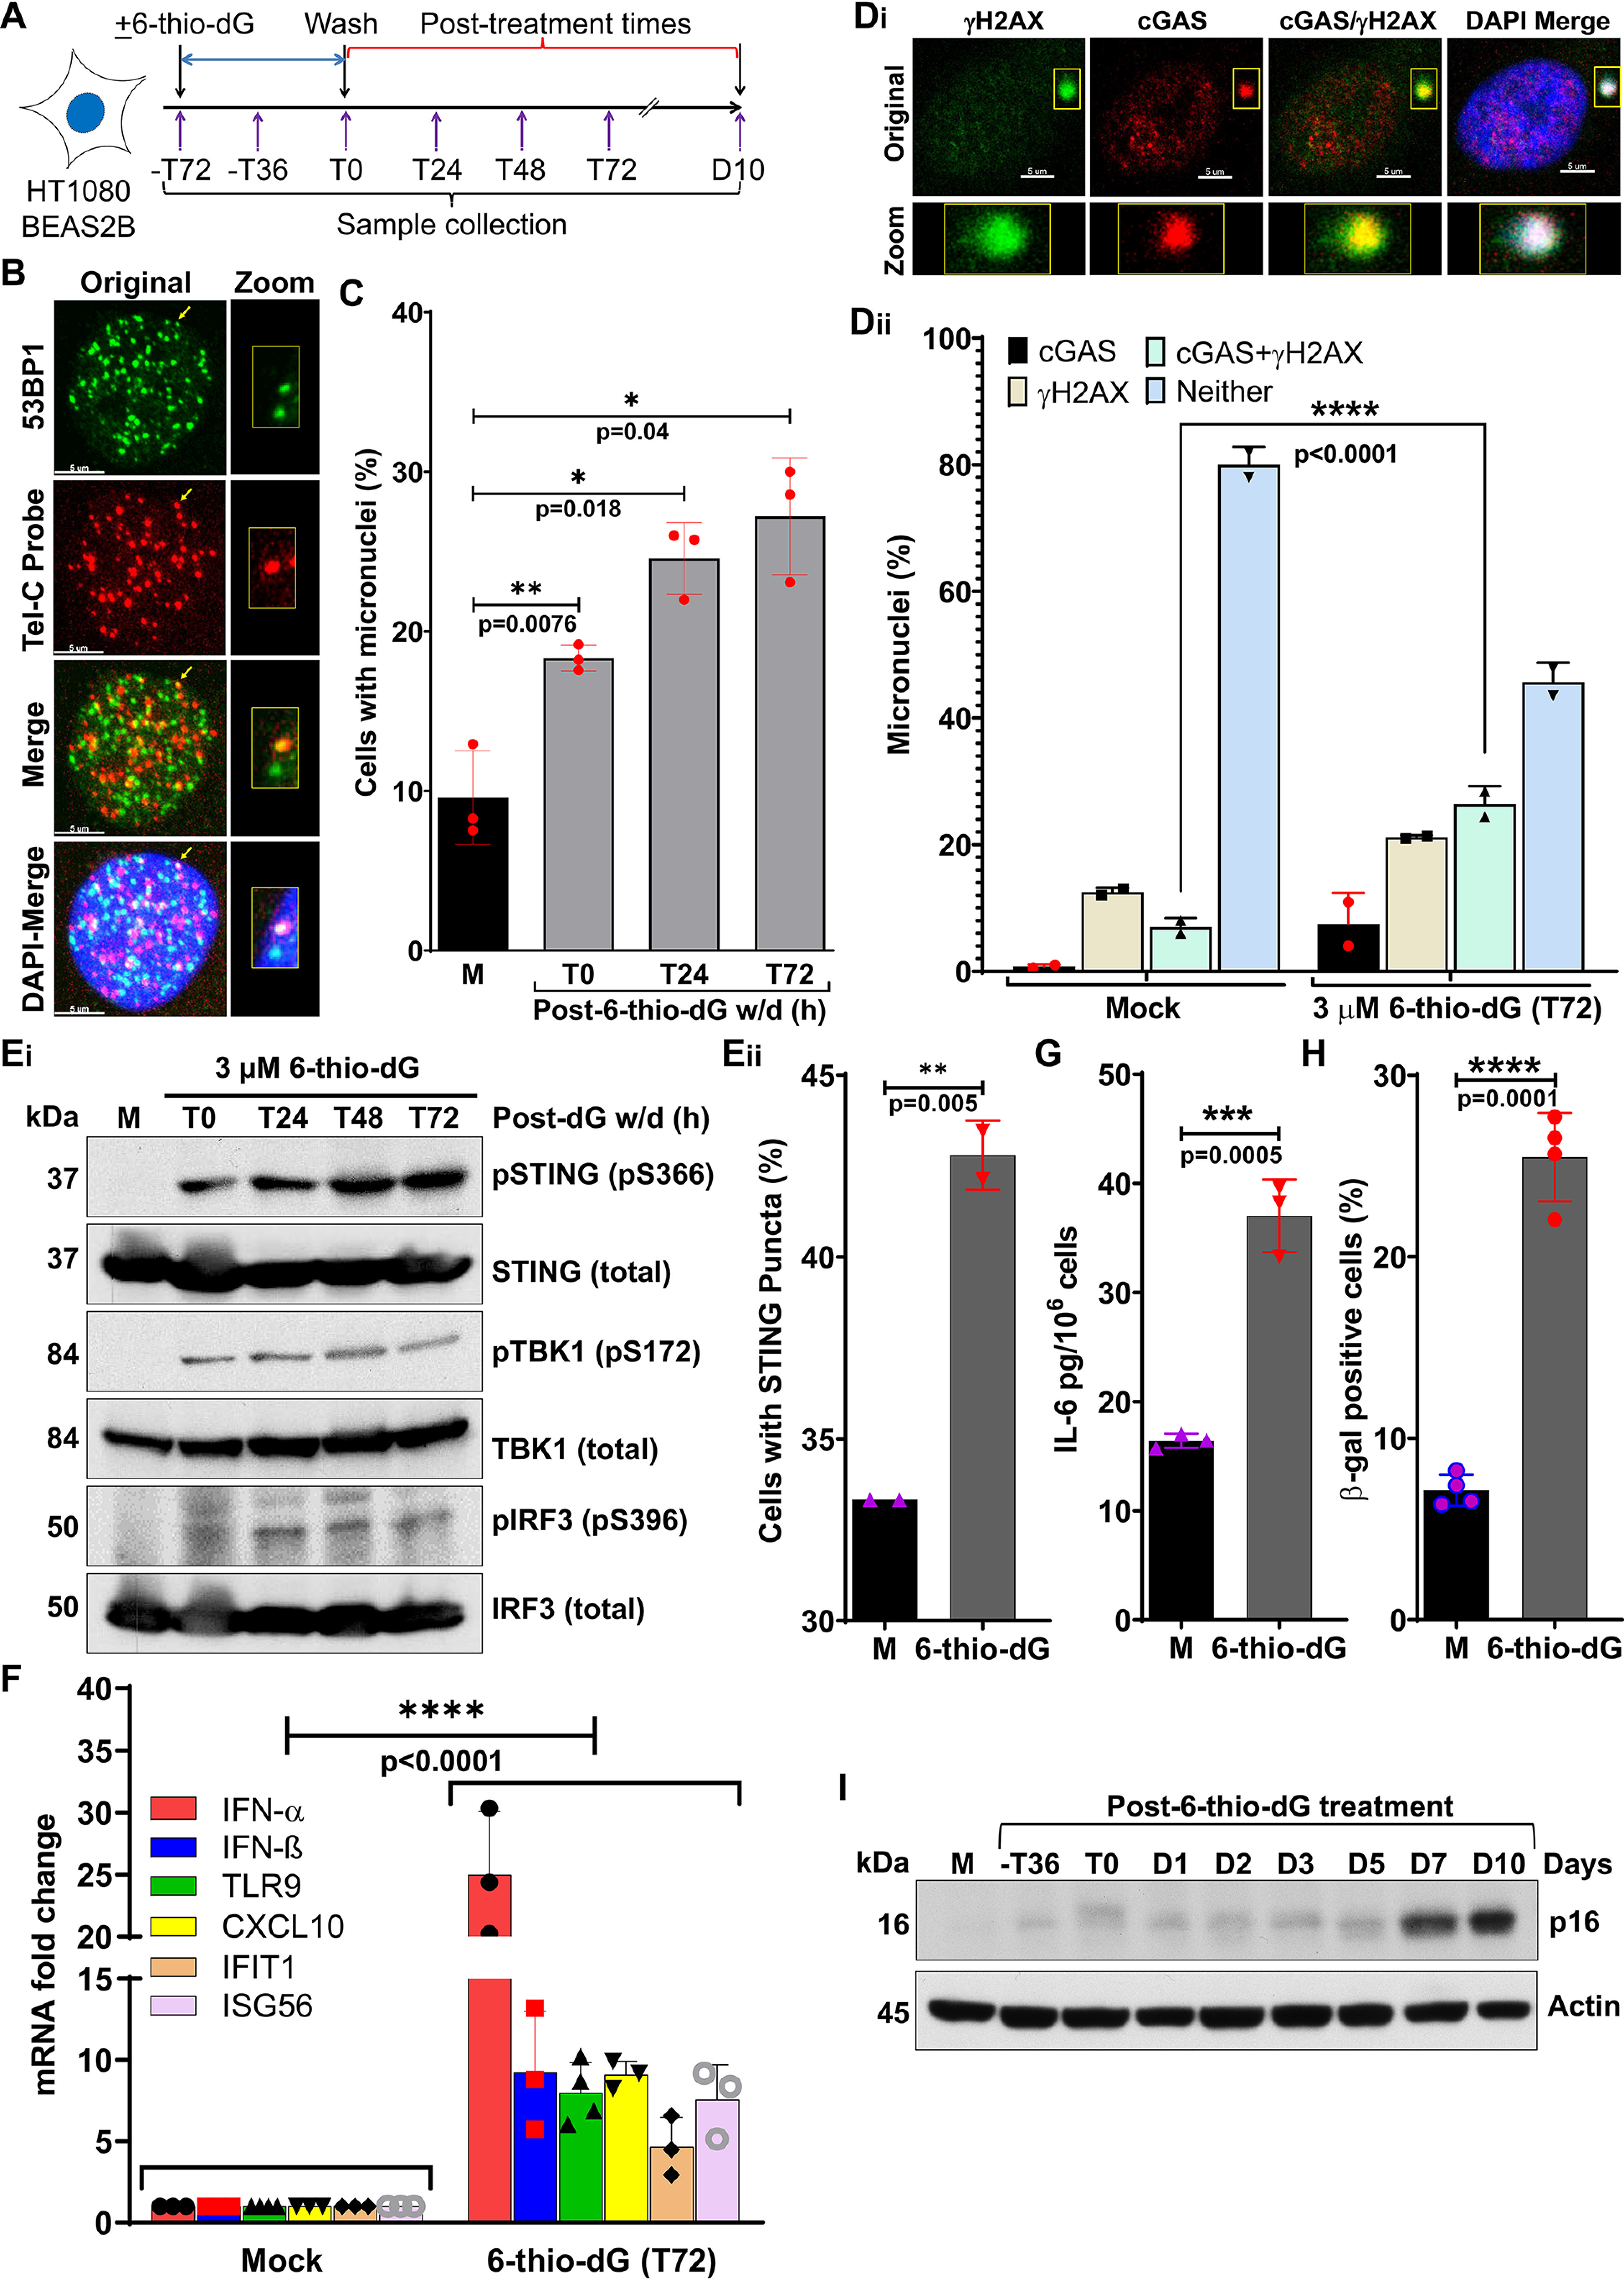
Figure 4.

Micronuclei generated in response to telomeric DNA replication stress recruit cGAS and cause cellular senescence. A, schematics of the experimental strategy used in panels B–I, showing treatment of HT1080 cells with 3 μm 6-thio-dG for 72 h, recovery in drug-free medium, and collection of samples at different post-treatment times; T, hours; D, days. B, 6-thio-dG treatment induces dysfunctional telomeres. Representative images show co-localization of TIF marker 53BP1 with telomere DNA marker (TelC) at 48 h (T48) after 3 μm 6-thio-dG withdrawal. C, bar graph shows the quantification of micronuclei percentage in mock-treated cells and in treated cells at the indicated times after 3 μm 6-thio-dG withdrawal. Bar graph presents the mean ± S.D. from three independent experiments. D, cGAS is recruited to micronuclei induced by 6-thio-dG. Representative images show co-localization of cGAS and γH2AX in micronuclei (i), and the graph shows the quantification of percentage of micronuclei positive for cGAS, γH2AX, cGAS/γH2AX, and neither (ii) in mock-treated cells and in treated cells at 72 h (T72) after 6-thio-dG withdrawal. Bar graph presents the mean ± S.D. from two independent experiments. E–G, dysfunctional telomeres induced by 6-thio-dG (dG) activate innate immune signaling. Western blots show phosphorylation of STING (S366), TBK1 (S172), and IRF3 (S396) at the indicated times after 6-thio-dG withdrawal in BEAS-2B cells (E, i); the graph shows the percentage of micronuclei-positive cells with STING puncta at 72 h after 6-thio-dG removal (E, ii); the graph shows increased levels of mRNAs associated with immune signaling quantified by qRT-PCR at 72 h after 6-thio-dG withdrawal (F); and the graph shows IL-6 levels in cell culture supernatant at 72 h (T72) after 6-thio-dG withdrawal (G). Bar graphs present the mean ± S.D. from 2 to 4 experimental triplicates. H and I, graph shows elevated levels of β-gal staining at 10 days (D10) after 6-thio-dG withdrawal (H). Bar graph presents the mean ± S.D. of four independent experiments. Western blotting shows p16 expression at the indicated post–6-thio-dG treatment times (I). Statistical analysis were performed using Student's t test (C, Eii, G, and H) and two-way ANOVA (Dii and F).
