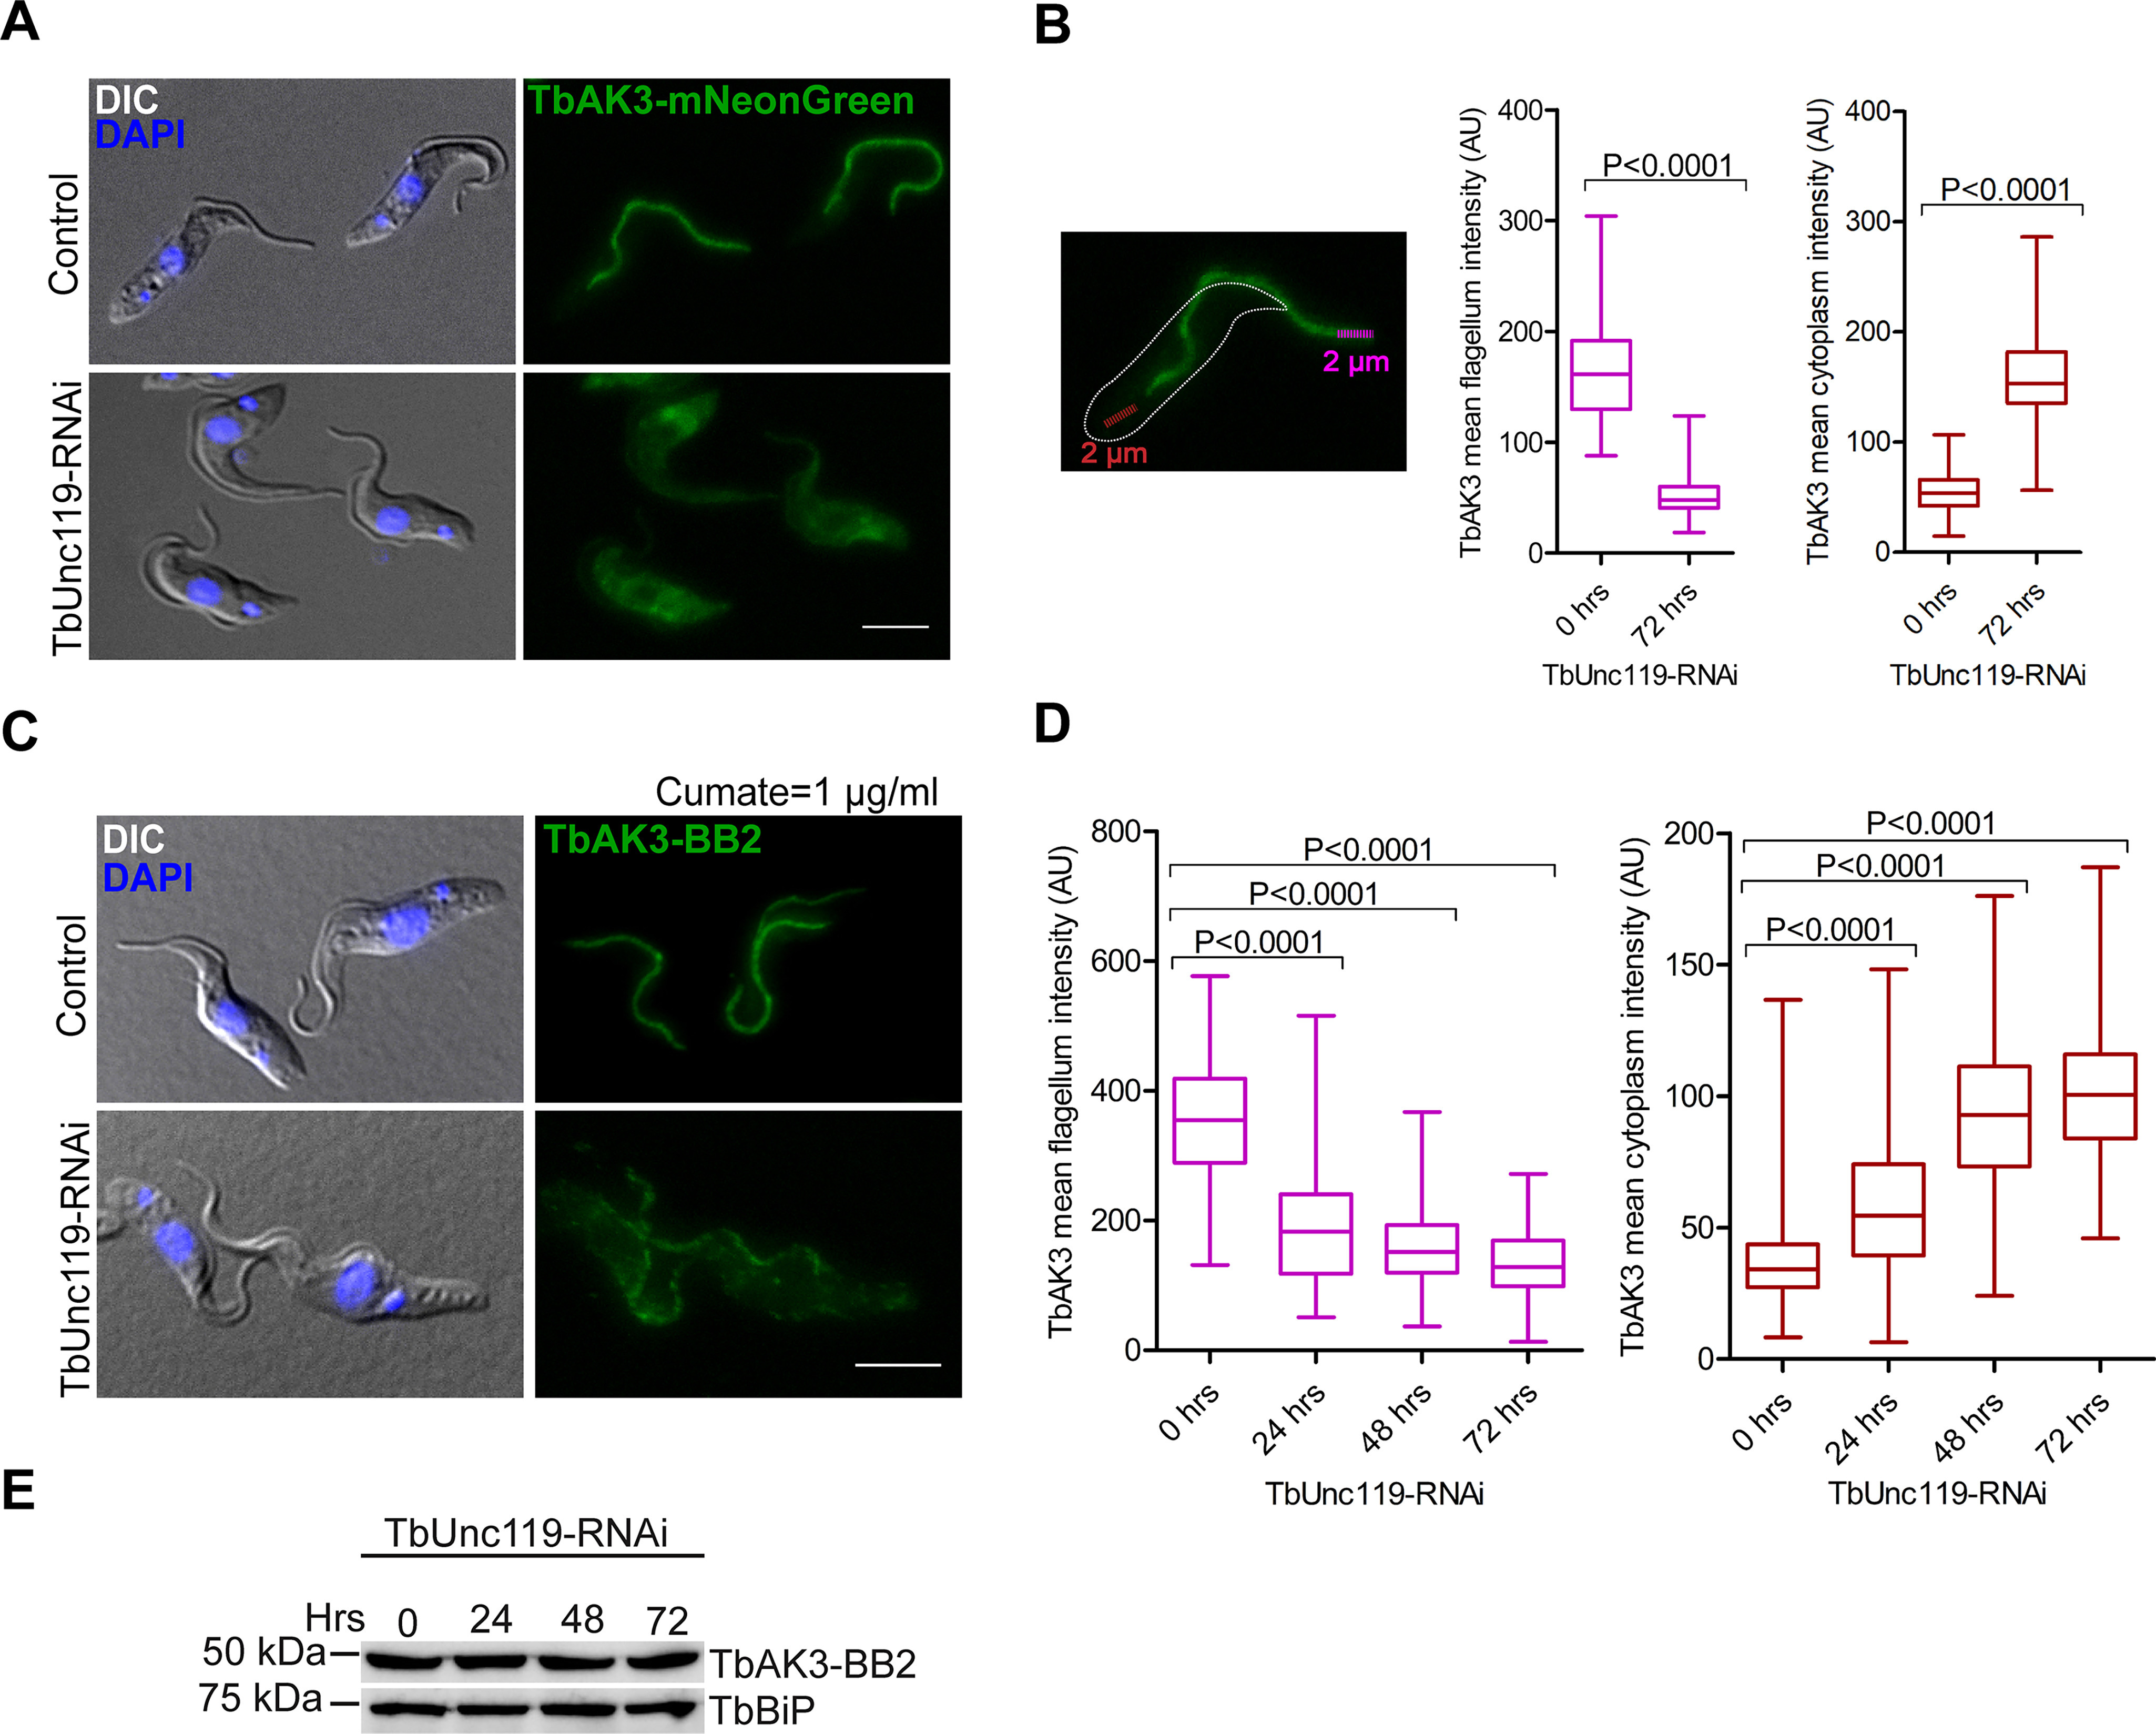
Figure 3.

Flagellar targeting of TbAK3 requires TbUnc119. A, procyclic cells stably expressing TbAK3-mNeonGreen from an endogenous allele were induced for TbUnc119-RNAi. Control and induced cells were fixed with 4% PFA. B, TbAK3-mNeonGreen intensity in the flagellum and in the cytosol was measured using plot profile function as illustrated here and detailed under “Experimental procedures.” Results are shown as box plots, with the whiskers marking the minimum and maximum values, the box showing the 25th to 75th percentiles and the bars in the box showing the median. n > 150 cells were measured for each condition at each time point. Two-tailed Student's t test was performed, and p values are indicated in the plots. C–E, cells containing tetracycline-inducible TbUnc119-RNAi and cumate-inducible TbAK3-BB2 expression were induced for TbUnc119-RNAi for 0, 24, or 48 h prior to induction of TbAK3-BB2 expression. The induction of TbAK3-BB2 expression was fixed at 1 μg/ml of cumate for 24 h to ensure similar expression levels in different experiments (E). Cells were then fixed and processed for immunostaining with anti-BB2 (C). Quantitation of the TbAK3-BB2 signal in the flagellum and the cytosol was performed as illustrated in B. n > 100 cells were measured for each condition at each time point (D). Scale bar, 5 μm.
