Figure 4.

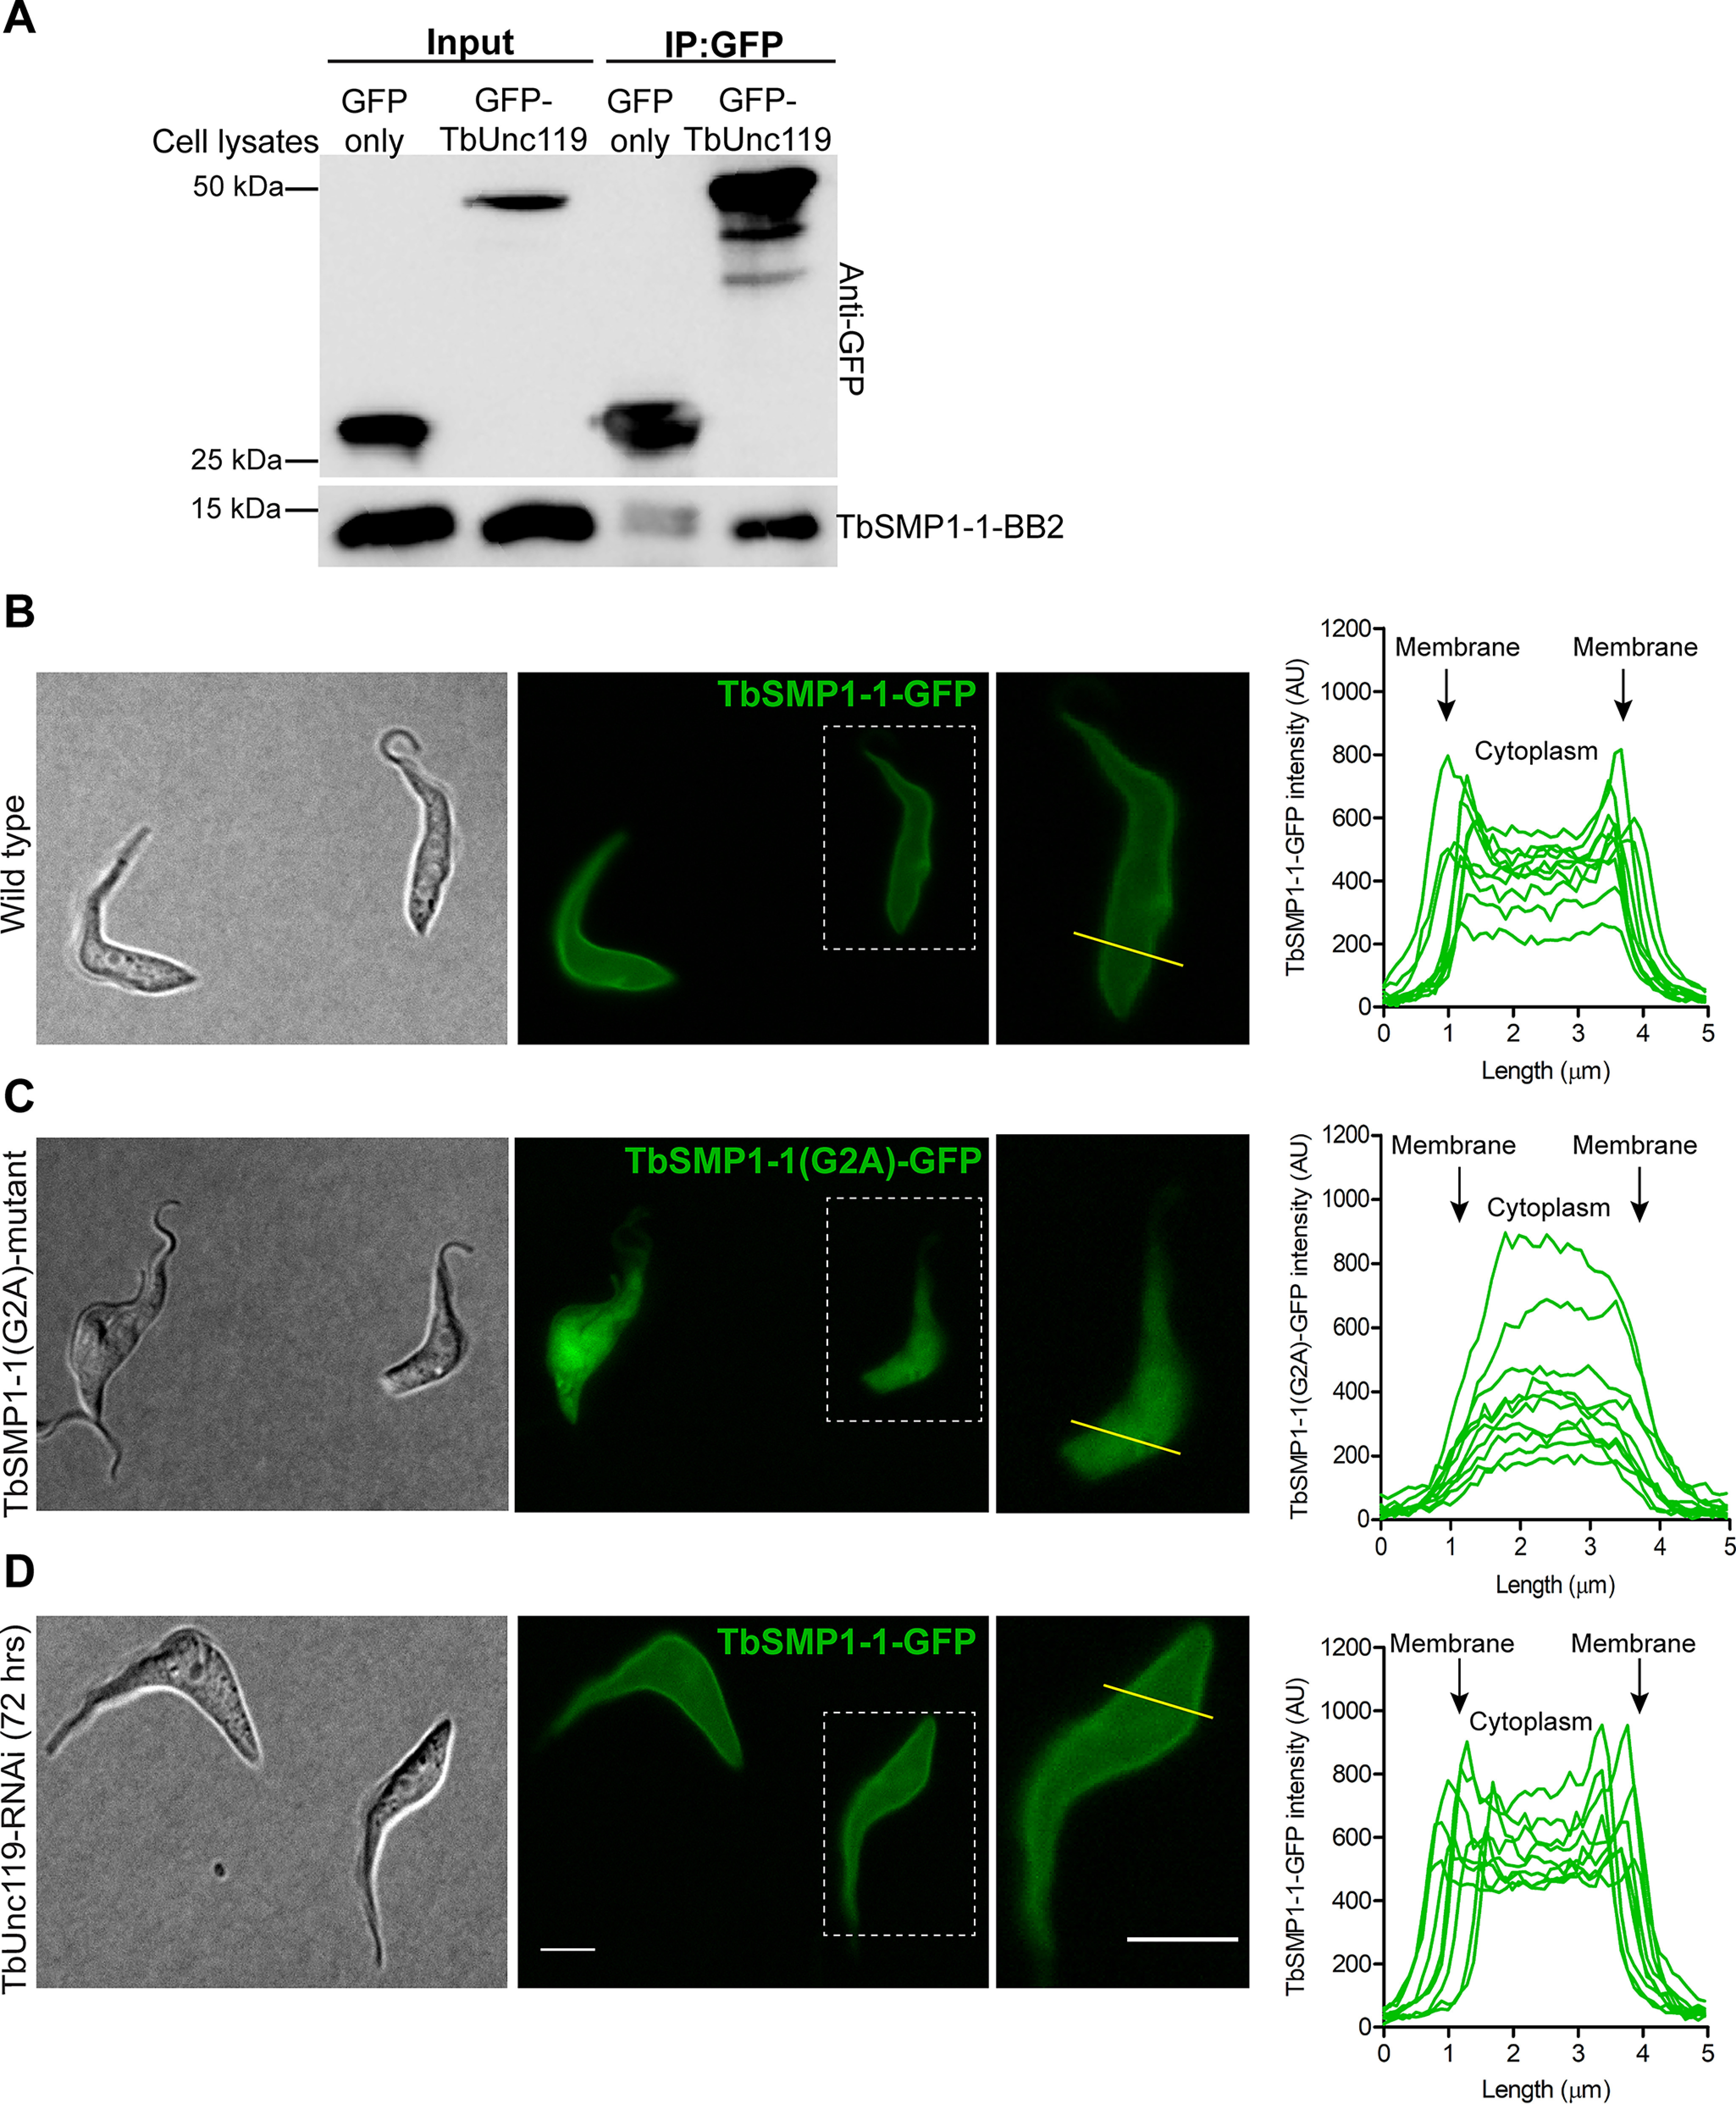
The cell membrane association of TbSMP1-1 is myristoylation-dependent but TbUnc119-independent. A, TbSMP1-1-BB2 co-immunoprecipitated with GFP-TbUnc119, but not GFP only. B–D, cells expressing TbSMP1-1-GFP (B) or TbSMP1-1(G2A)-GFP (C) were immobilized on agarose gel and imaged live, to best visualize the plasma membrane association of TbSMP1-1-GFP. The intracellular distribution of TbSMP1-1-GFP was also monitored in live cells induced for TbUnc119- RNAi (D). All GFP images were collected at constant exposure time. The distribution of TbSMP1-1-GFP in control and TbUnc119-RNAi cells was measured using plot profiling. A line of 5 μm length was drawn across the entire cell body, encompassing cell membranes at both ends, and fluorescence intensity along the length of this line was plotted. 10 representative cells were shown for control and TbUnc119-RNAi cells. Insets show enlarged images of a representative cell from each sample that selected for intensity measurements. Scale bar, 5 μm.
