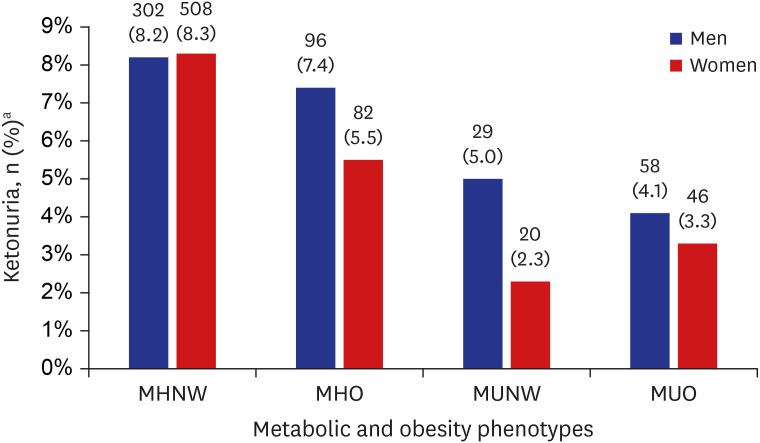
Fig. 2. Proportion of ketonuria in each metabolic and obesity phenotype.
P value < 0.001 both in men and women; P value is calculated by χ2 test under complex sample analysis.
MHNW = metabolically healthy normal weight, MHO = metabolically healthy obese, MUNW = metabolically unhealthy normal weight, MUO = metabolically unhealthy obese.
aValues are presented as unweighted number (weighted %).

