
Figure 3.
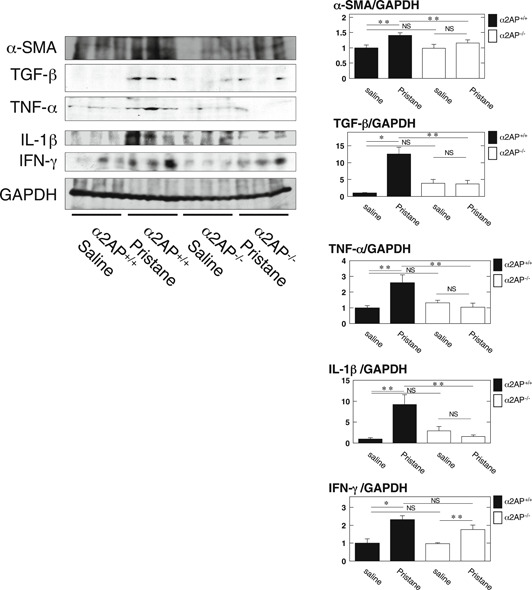
α2AP deficiency attenuated the inflammatory cytokine production in the pristane‐induced lupus mouse model. The expression of each protein in kidney from the saline or pristane‐treated α2AP+/+ and α2AP−/− mice was examined by Western blot analysis. The histogram on the right panels shows quantitative representations of each protein obtained from densitometry analysis (n = 3). The data represent the mean ± SEM. *P < .01. **P < .05. α2AP, alpha2‐antiplasmin; NS, not significant