
FIGURE 1.
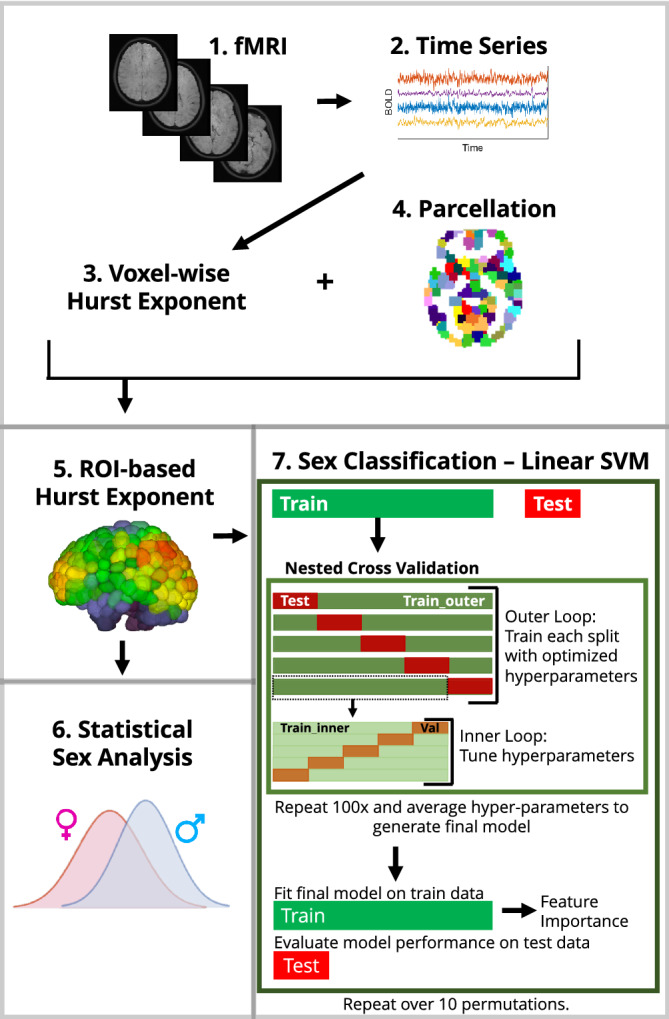
Overall workflow of analysis. (1) Functional MRI images from the Human Connectome Project were used to extract (2) voxel‐wise time series. (3) Voxel‐wise Hurst exponents were computed. (4) Parcellations of the voxels were generated for seven different atlases and (5) Hurst exponents were averaged for all voxels within a given ROI to generate ROI‐based Hurst exponents. (6) Sex differences in regional Hurst exponent were analyzed using a Student's t test. (7) Prediction of sex was performed using a linear SVM classifier. Nested cross validation was used to optimize hyperparameters and a final model was fitted to the train data and evaluated on the test data