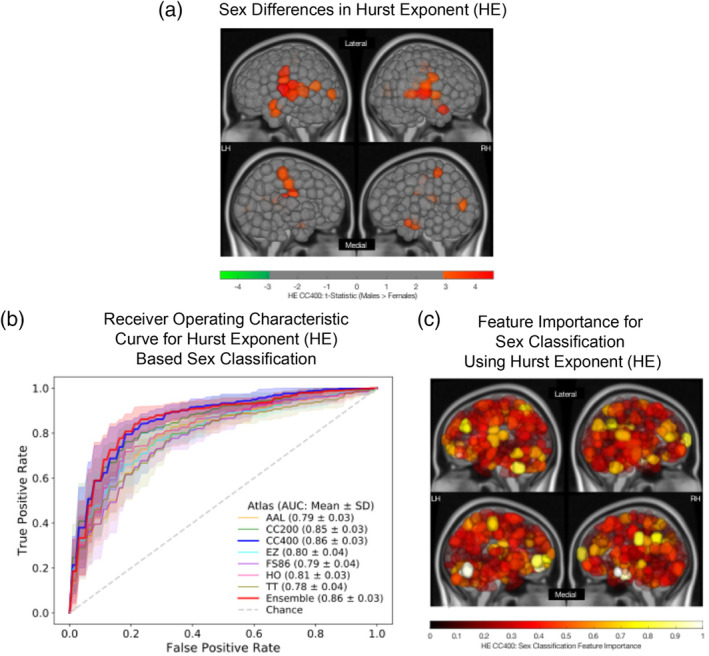
FIGURE 2.

Sex differences and classification using regional Hurst exponent (HE). (a) Region‐wise sex differences in HE for the CC400 atlas. Lateral (top) and medial (bottom) sides of the left (LH) and right (RH) hemispheres are shown. Regional t‐statistics are shown as per the color scale for all significantly different (p‐corrected <.05) areas. Nonsignificant areas are shown in grey. A positive t‐statistic indicates that males have a higher mean value in that region than females. (b) Receiver operating characteristic curves for linear support vector machine (SVM) sex classification for all atlases based on HE. Mean and SD of the area under the curve (AUC) values for each atlas are indicated. (c) Feature importance map for a linear SVM classifier used to predict sex using HE computed on the CC400 atlas. Lateral (top) and medial (bottom) sides of the left (LH) and right (RH) hemispheres are shown. The absolute value of feature weights obtained from the linear SVM were scaled to generate normalized feature importance values as plotted per the color scale. Values closer to one indicate greater importance in the overall classification
