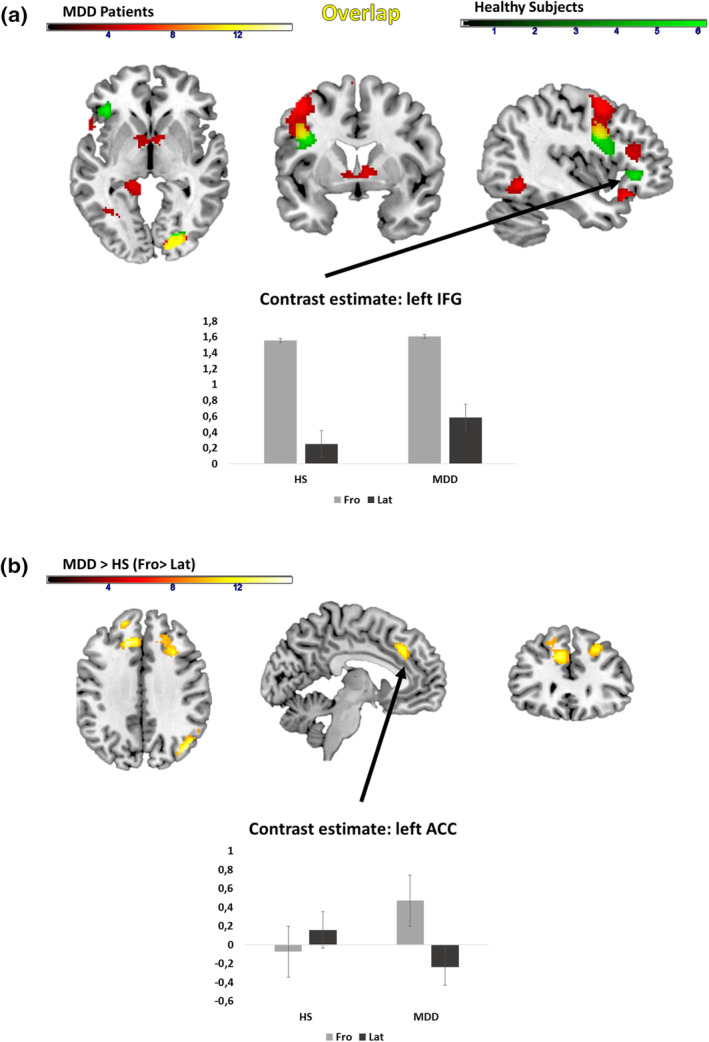
FIGURE 4.

Main effect of orientation in MDD patients (red), healthy subjects (green) and shared activations in MDD patients and healthy subjects (yellow). (a) Conjunction analysis for shared activations between MDD patients and HS. (b) Interaction between group and body orientation. Bar graphs show the extracted eigenvariates of the respective clusters of the conjunction (a) or interaction effect (b). The error bars of the bar graphs are indicating the SE of the mean. Fro, frontal view; IC, iconic gesture; Lat: lateral view; NG, no gesture; MDD, major depressive disorder
