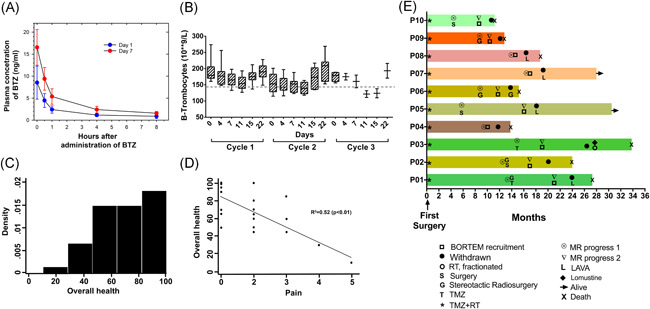
Figure 2.

Clinical, radiological and quality of life response. A, Pharmacokinetic analysis of bortezomib concentration (ng/mL) in plasma of patients following five timepoints on day 1 and 7 of treatment. B, Thrombocyte counts during the first three treatment cycles. Data represent the mean ± SEM from n = 10 patients. C, Density scores for perception of overall health on EQ‐5D‐5L questionnaire. D, Correlation of self‐reported overall health and levels of pain on EQ‐5D‐5L. E, Swimmer plot of individual patients depicting treatment start/stop times of all trial patients, aligned according to their first surgery. Bars represent survival in months from first surgery, first and second MRI progression. Rightward arrow indicates that the patient was still alive at the time of final data collection
