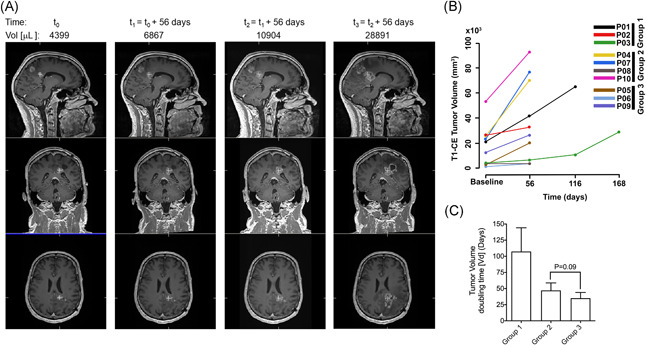
Figure 3.

Tumour growth and population doubling time. A, Coregistered 3D T1 weighted gadolinium contrast enhanced serial MR image of patient‐03 (IDHwt; MGMT UM, 54 years male) treated for 6 months, time indicated in days and tumour volume in µL. B, Mean of 3D measured tumour volumes in mm3 from T1‐weighted MR images with contrast of all patients, and (C) tumor population doubling time (in days) for group 1, 2, and 3 patients
