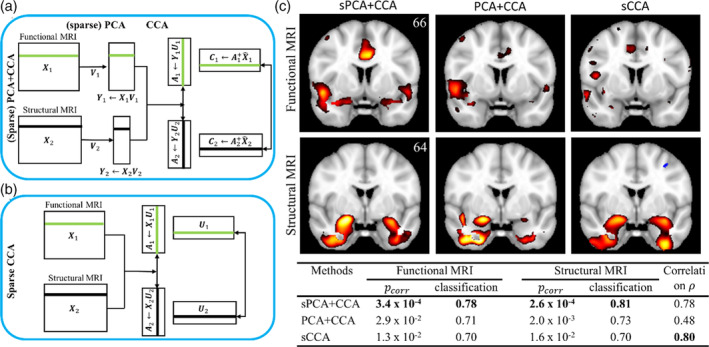
FIGURE 5.

Example of choosing canonical correlation analysis (CCA) variants by following the guideline. Voxel‐wise functional and structural MRI information from cognitive normal subjects and subjects with mild cognitive impairment were used for data fusion analysis. (a) Schematic diagram of (sparse) principal component analysis (PCA) + CCA. The abbreviation sPCA stands for sparse PCA. (b) Schematic diagram of sparse CCA (sCCA). (c) Top panel shows the most disease‐discriminant functional and structural component and the bottom panel shows the correlation between datasets (ρ), the significance of the correlation derived from nonparametric permutation test (pcorr) and the classification accuracy for each method
