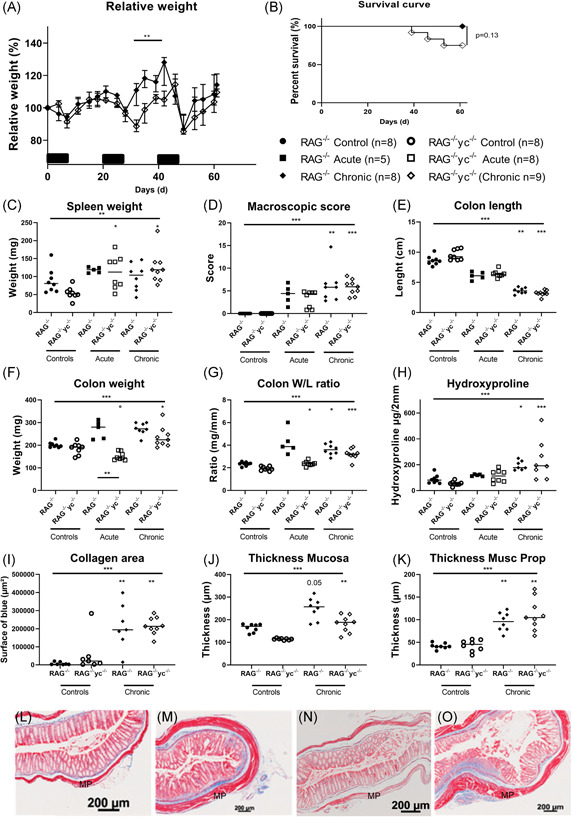
Figure 5.

Fibrosis is not attenuated in RAG−/−γc−/− mice after three cycles of DSS. RAG−/− and RAG−/−γc−/− mice were cohoused during either acute (RAG−/−: n = 5 and RAG−/−γc−/−: n = 8) or chronic DSS colitis (RAG−/−: n = 8 and RAG−/−γc−/−: n = 9) compared with control mice without DSS exposure (n = 8 for both strains) and killed on day 9 (acute) or day 63 (chronic). Relative weight curve (A) and Kaplan‐Meier curve (B) (only RAG−/− and RAG−/−γc−/− chronic DSS shown to highlight discrepancies). Disease parameters: spleen weight (C), macroscopic score (D), colon length (E), colon weight (F), and colon W/L ratio (G). Fibrosis parameters: hydroxyproline quantification (H), quantification of the surface of collagen in MSB staining (I), thickness of the mucosa (J), and thickness of the muscularis propria (K). Representative pictures of MSB staining in RAG−/− control mice without DSS exposure (L) and chronic DSS colitis mice (M) compared with RAG−/−γc−/− control (N) and chronic DSS colitis mice (O). Kruskal‐wallis testing is shown, multiple testing with Dunn's correction compared with healthy background controls is shown above each group; multiple testing with Dunn's correction between groups is shown by a connecting line. *P < .05, **P ≤ .01, ***P ≤ .001. Data are shown as individual values with median. Data are pooled from two independent experiments. DSS, dextran sulfate sodium; MP, muscularis propria; MSB, Martius Scarlet Blue; RAG, recombination activating gene; W/L, weight/length
