
FIGURE 6.
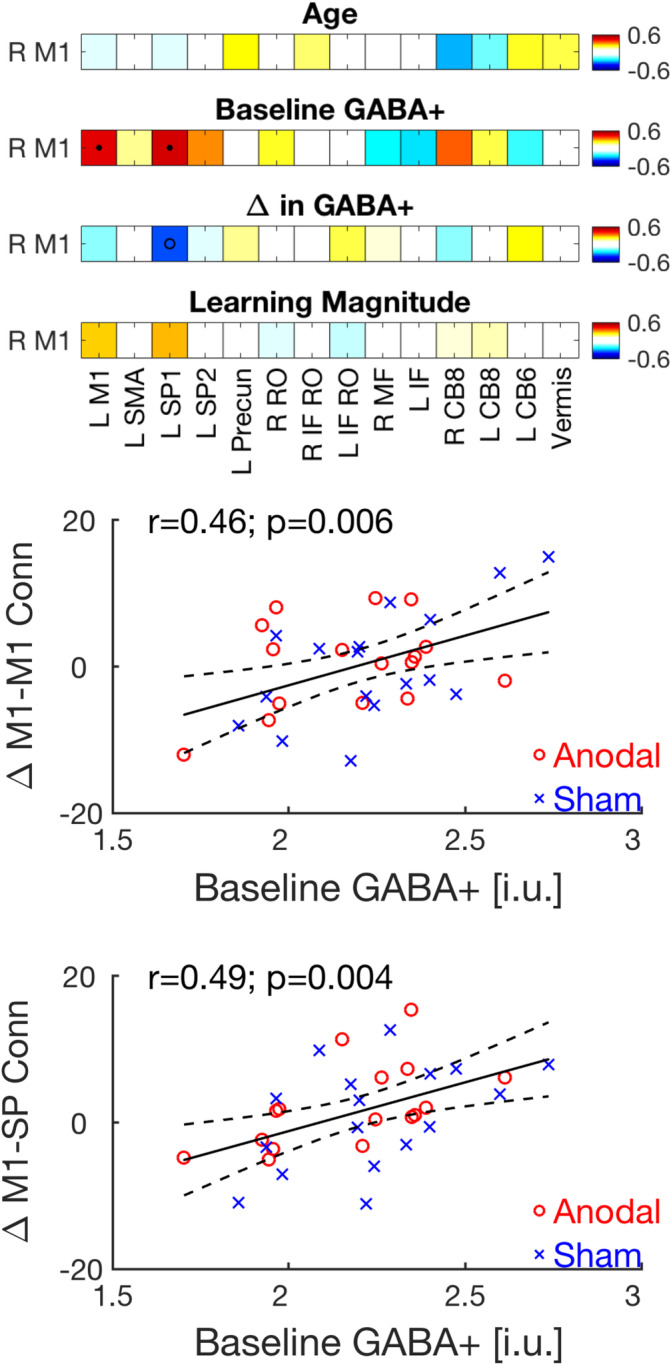
(a) Relationships between the change in RS functional connectivity between the right M1 seed and the 14 motor task‐relevant ROIs across the two RS time points and age (top row), baseline GABA+ levels (second from top), change in GABA+ (second from bottom) and motor sequence learning magnitude (bottom row). Values represent Pearson's correlation coefficients conducted across the anodal and sham groups (n = 33). Tests of statistical significance were based on comparisons of the coefficients to a correlation of 0 and corrected for multiple comparisons with a FDR threshold set to 0.05. Corrected p value threshold for the relationships between change in connectivity and baseline GABA+ was .0064. • = p(FDR) < .05; o = p(uncorrected) < .05. (b,c) Significant relationships between baseline GABA+ and the change in connectivity across the two RS time points between right M1 and left M1 (b) and left SP cortex (c) are depicted. Solid dark lines represent linear regression fits; dashed lines depict 95% prediction intervals of the linear function. Correlations were conducted across the two experimental groups (n = 33), but the anodal and sham participants are shown in red circles and blue crosses, respectively. Note that these significant correlations survive FDR correction for multiple comparisons. The numbers 6 and 8 represent the cerebellar lobules. CB, cerebellar; FDR, false discovery rate; GABA, gamma‐aminobutyric acid; IF, inferior frontal; i.u., institutional units; L, left; M1, primary motor cortex; MF, medial frontal; Precun, precuneus; R, right; RO, rolandic operculum; ROIs, regions of interest; RS, resting state; SMA, supplementary motor area; SP, superior parietal