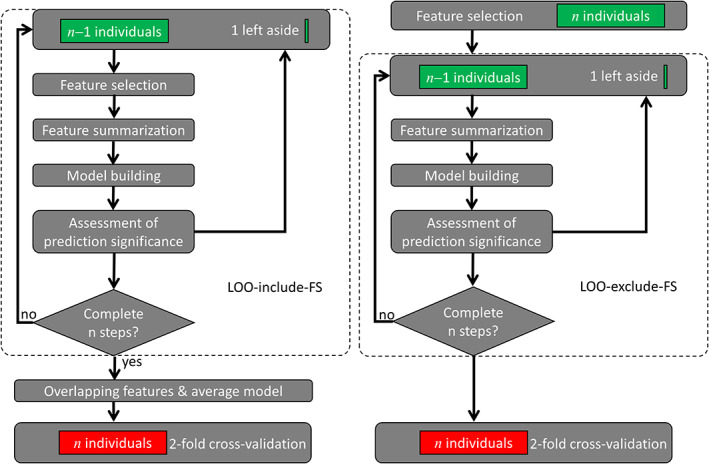
FIGURE 1.

Connectome‐based predictive modeling (CPM) flowcharts. Two leave‐one‐out (LOO) cross‐validation procedures, which included (LOO‐include‐feature selection [FS]; left) or excluded (LOO‐exclude‐FS; right) FS from the LOO loop (dashed rounded rectangles). Green rectangles represent imaging and behavioral data from the training sample (n = 212), which were used to develop connectome‐based predictive models for predicting behavior from functional connectivity data. The red rectangle in the twofold cross‐validation step represents imaging and behavioral data from the independent test sample (n = 212), which was used to validate the prediction models
