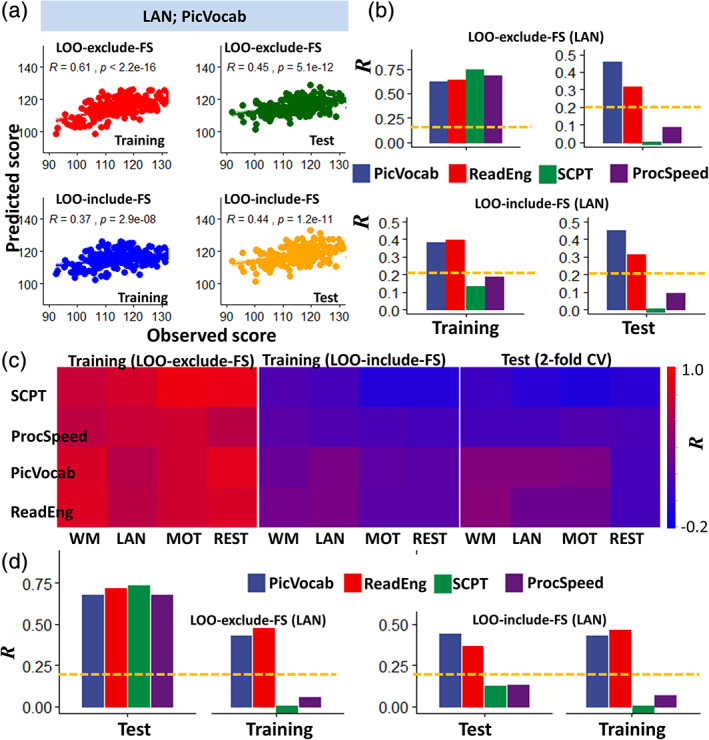
FIGURE 2.

Prediction of language and other cognitive measures. (a) Linear associations between observed scores of vocabulary comprehension (PicVocab) and corresponding correlation factors (R) derived from language‐fMRI (LAN) data in the training sample (n = 212), excluding (red; leave‐one‐out [LOO]‐exclude‐feature selection [FS]) and including (blue; LOO‐include‐FS) FS in the LOO cross‐validation algorithm, and in the test sample (n = 212) using the optimal models (dark green and orange). (b) Pearson correlation factors between observed and predicted language and control‐task scores for the training and test samples. (c) Heat maps showing R‐values as a function of cognitive tests (rows) and task‐fMRI sessions (columns) for training and test (LOO‐include‐FS) samples. (d) Prediction of language and control task scores exchanging the roles of the original Training and test samples to complete the validation. Shen parcellation, language‐fMRI session, FS threshold p < .01, bilinear model. Abbreviations for fMRI sessions: WM, working memory; LAN, language; MOT, motor. Abbreviations for language measures: PicVocab (picture vocabulary) and ReadEng (oral reading recognition) and for control measures: ProcSpeed (processing speed) and SCPT (short Penn continuous performance). Statistical significance threshold: p < .05, Bonferroni corrected for 16 comparisons (dashed yellow line). *p < 2E‐16, analysis of variance (ANOVA)
