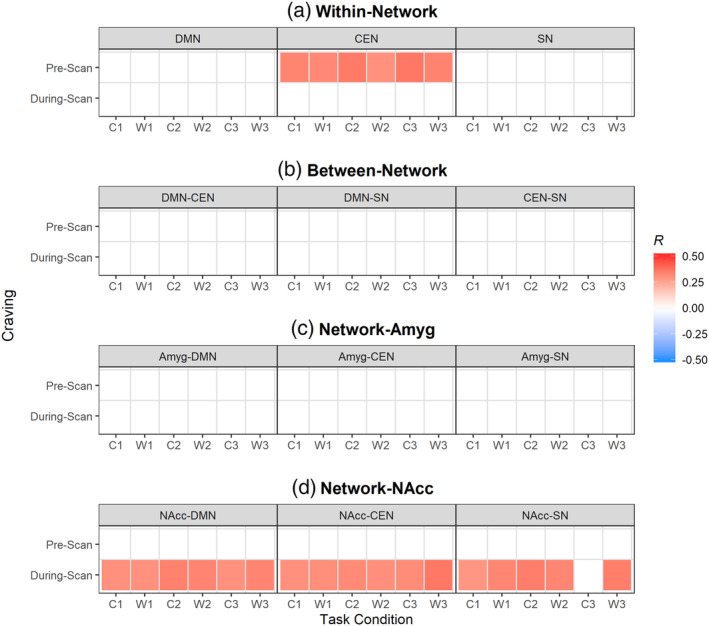
FIGURE 5.

Correlation of standard deviation of primary measure in dynamic functional connectivity with craving scores in cannabis users (CAN). Correlation coefficients that survive the multiple comparison correction using FDR q ≤ 0.250 and uncorrected p < .050 (out of 144 cases) are shown as colored boxes. Each box is color‐coded to represent the direction of correlation (Spearman's rho), where red is positive and blue is negative. The color scale is identical across all types of primary measures. The X‐axis represents task conditions (C1, W1, C2, W2, C3, and W3) and Y‐axis the craving scores in the order of prescan (subject n = 52) and during‐scan (n = 54). Abbreviations indicate default mode network (DMN), central executive network (CEN), salience network (SN), amygdalae (Amyg), and nuclei accumbens (NAcc). Task conditions abbreviated are neutral cue ON (C1), neutral cue OFF (W1), natural reward cue ON (C2), natural reward cue OFF (W2), cannabis cue ON (C3), cannabis cue OFF (W3)
