3.
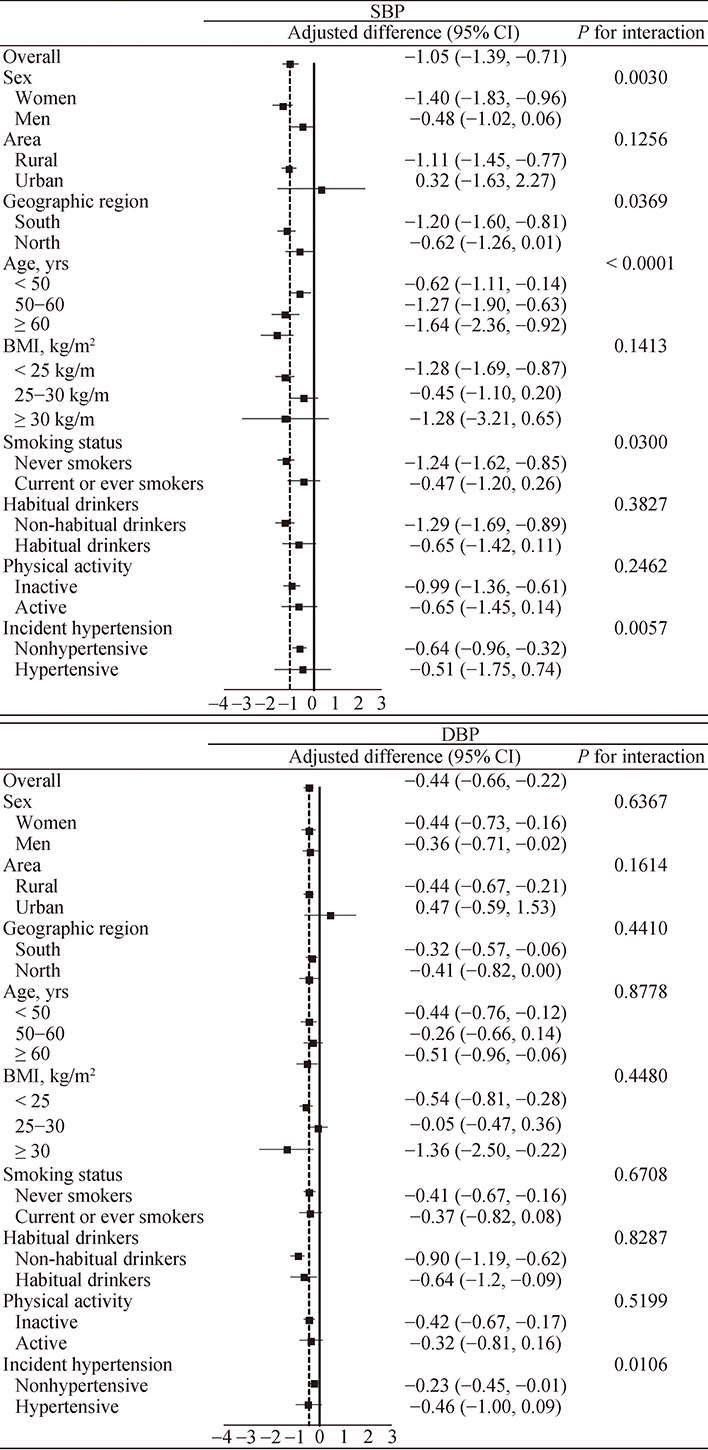
Changes in SBP and DBP (mmHg) during a median follow-up period of 7.4 years with ideal intake of soybean products (≥ 125 g/day).
Adjusted for age, sex, baseline BMI and SBP, geographic region, urbanization, cohort sources, education level, family history of hypertension, smoking and drinking status, and physical activity level. The black boxes represent changes in SBP and DBP and the horizontal lines represent 95% confidence intervals. DBP: diastolic blood pressure; SBP: systolic blood pressure.

