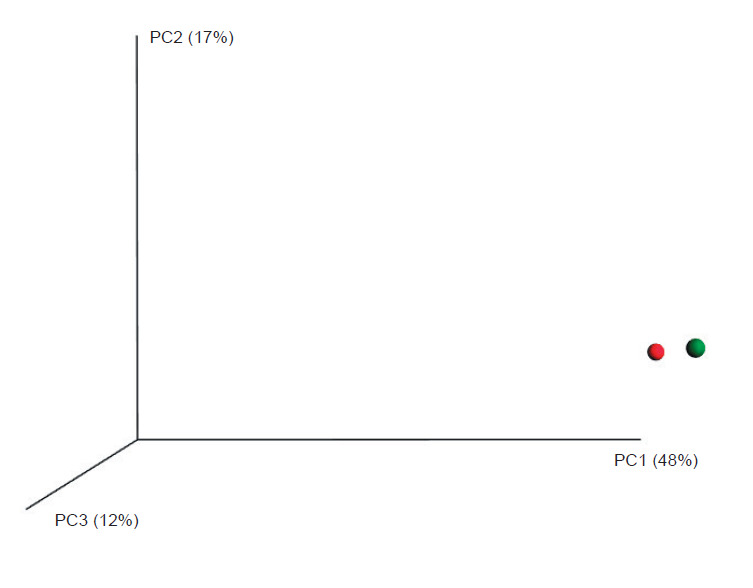
Fig. 2.

Principal coordinate analysis plot based on unweighted UniFrac distance matrices for kefir A (Athens, red circle) and kefir B (Crete, green circle). UniFrac measures the phylogenetic distance between sets of taxa in a phylogenetic tree as a fraction of branch length. This metric captures the total amount of evolution that is unique to each sample, reflecting adaptation to one environment that could be deleterious to the other. The percentages in the axis labels represent the percentages of variation explained by the principal coordinates
