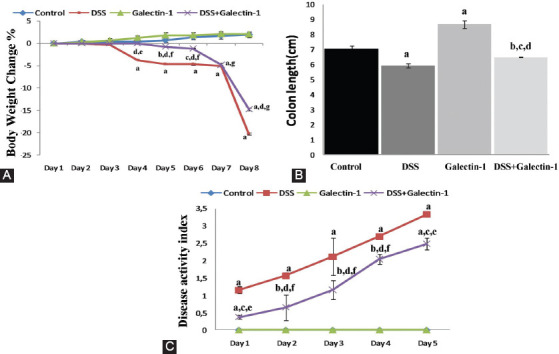
FIGURE 2.

(A) Body weight change (%) in all groups. Beginning from the 4th day of the experiment, when the symptoms of colitis were observed, a significant decrease in the body weight of mice in DSS group was detected compared to control group. The body weight of mice in DSS+galectin-1 group significantly increased throughout the experiment from the 4th day (except on the 7th day) compared to DSS group. ap < 0.001, bp < 0.05, and cp < 0.01 vs. control group; dp < 0.001 vs. DSS group; ep < 0.05, fp < 0.01, and gp < 0.001 vs. galectin-1 group. (B) Colon length in all groups. The lengths of colon tissues in DSS group were markedly decreased compared to control group. There was a remarkable increase in the colon lengths in the group treated with Gal-1 alone compared to control animals. The colon lengths in DSS+galectin-1 group were significantly increased compared to DSS group. ap < 0.001 and bp < 0.05 vs. control group; cp < 0.01 vs. DSS group; dp < 0.001 vs. galectin-1 group. (C) Daily disease activity index (DAI) in DSS-induced experimental groups. DAI was measured at 24, 48, 72, 96, and 120 hours after DSS administration. DAI was elevated with the induction of ulcerative colitis. Gal-1 treatment significantly reduced DAI compared to DSS group. ap < 0.001 and bp < 0.01 vs. control group; cp < 0.001 and dp < 0.01 vs. DSS group; ep < 0.001 and fp < 0.01 vs. galectin-1 group. DSS: Dextran sulfate sodium.
