
FIGURE 3.
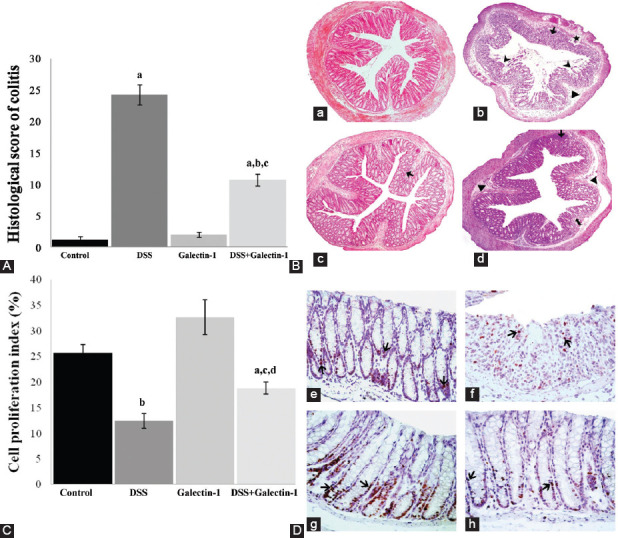
(A) Histological colitis score of all groups. The histological score showed a statistically significant increase in DSS compared to control group. The pre-injection of Gal-1 to DSS-induced mice significantly reduced the colonic damage. Data are given as mean ± SE per group. ap < 0.001 vs. control group; bp < 0.001 vs. DSS group; cp < 0.001 vs. galectin-1 group. (B) Light microscope image of the colon in control group (a). Light micrograph of DSS-induced ulcerative colitis group (b) shows inflammatory cell infiltration (⟶), submucosal edema (►), focal mucosal deterioration (★), necrotic areas in the mucosa and submucosa ( ), disruption of crypt integrity and widespread loss of crypts. Galectin-1 group (c) and DSS+galectin-1 group (d) micrographs show slight inflammatory cell infiltration (⟶). In addition, the image of DSS+galectin-1 group demonstrates submucosal edema (
 ) and disruption of crypt integrity (►). Hematoxylin-eosin; original magnification ×100. (C) Cell proliferation index determined by Ki-67 immunohistochemistry in colon mucosa. The cell proliferation index of DSS group showed a statistically significant decrease compared to control group. The suppressive effects of DSS on the proliferation of colon epithelial cells were inhibited by Gal-1 pre-injection, and the proliferation index markedly increased compared to DSS group. ap < 0.05 vs. control group; bp < 0.01 vs. control group; cp < 0.05 vs. DSS group; dp < 0.01 vs. galectin-1 group. (D) Proliferating cells marked by Ki-67 immunohistochemistry in the distal colon mucosa of mice (
 ). Control group (e), DSS group (f), galectin-1 group (g), DSS+galectin-1 group (h). Streptavidin-biotin-peroxidase staining method; original magnification ×400. DSS: Dextran sulfate sodium.