
FIGURE 4.
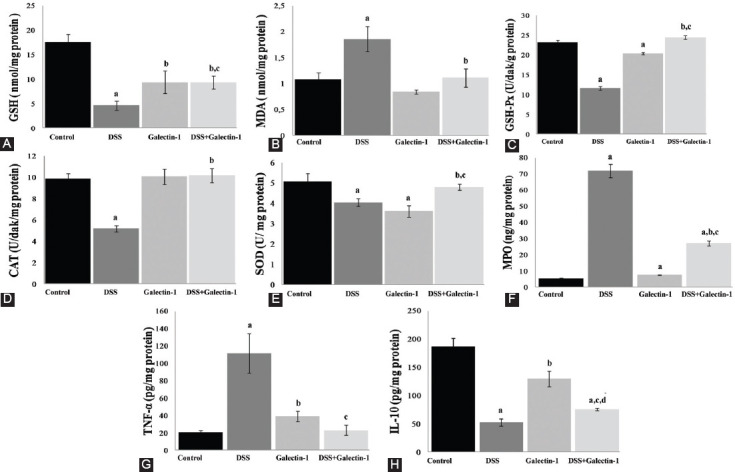
(A) GSH levels in the mouse colon tissues. ap < 0.001 and bp < 0.01 vs. control group; cp < 0.05 vs. DSS group. (B) MDA levels in the mouse colon tissues. ap < 0.05 vs. control group; bp < 0.05 vs. DSS group. (C and D) GSH-Px and CAT activities in the mouse colon homogenates. ap < 0.001 vs. control group; bp < 0.001 vs. DSS group; cp < 0.001 vs. galectin-1 group. (E) SOD activity in the mouse colon tissues. ap < 0.05 vs. control group; bp < 0.05 vs. DSS group; cp < 0.01 vs. galectin-1 group. (F) MPO concentration in the mouse colon homogenates. ap < 0.001 vs. control group; bp < 0.001 vs. DSS group; cp < 0.001 vs. galectin-1 group. (G) TNF-α levels in the mouse colon tissues. ap < 0.01 vs. control group; bp < 0.05 vs. control group; cp < 0.01 vs. DSS group. (H) IL-10 cytokine levels in the mouse colon tissues. ap < 0.001 vs. control group; bp < 0.05 vs. control group; cp < 0.05 vs. DSS group; dp < 0.01 vs. galectin-1 group. All data are given as mean ± SE per group. GSH: Glutathione; DSS: Dextran sulphate sodium; MDA: Malondialdehyde; GSH-Px: Glutathione peroxidase; CAT: Catalase; SOD: Superoxide dismutase; MPO: Myeloperoxidase; TNF-α: Tumor necrosis factor alpha; IL: Interleukin.