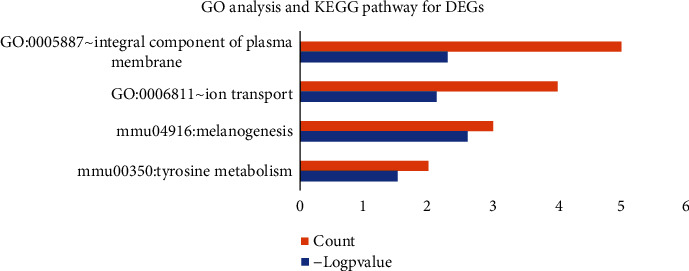
Figure 2.

List of GO-terms with significant enrichment of DEGs. From top to bottom, the enrichment value decreases. The red X-axis indicates the number of unigenes in a category; the blue X-axis indicates the value of log2 (p value) in corresponding category. The Y-axis indicates the specific category.
