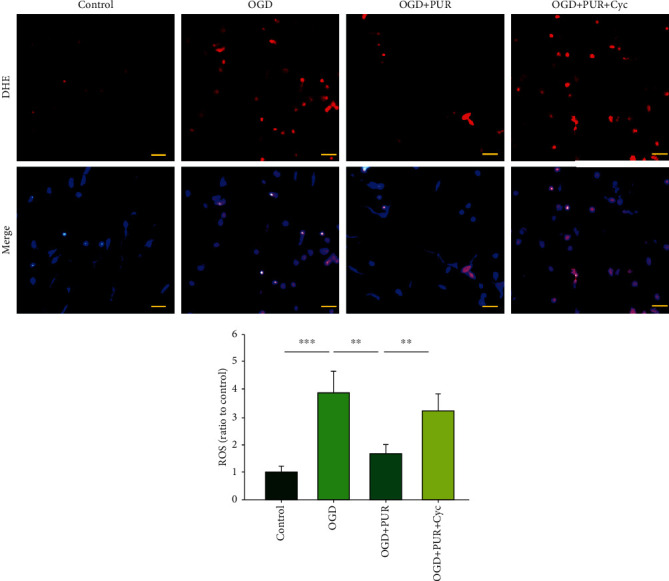
Figure 3.

PUR activation of Shh on OGD-induced ROS generation. ROS levels were determined by DHE staining at 24 h after OGD (N = 4/group; scale bar = 50 μm). Values represent the mean ± SD; ∗∗p < 0.01 and ∗∗∗p < 0.001 according to ANOVA with Tukey's post hoc comparisons.
