Figure 4.

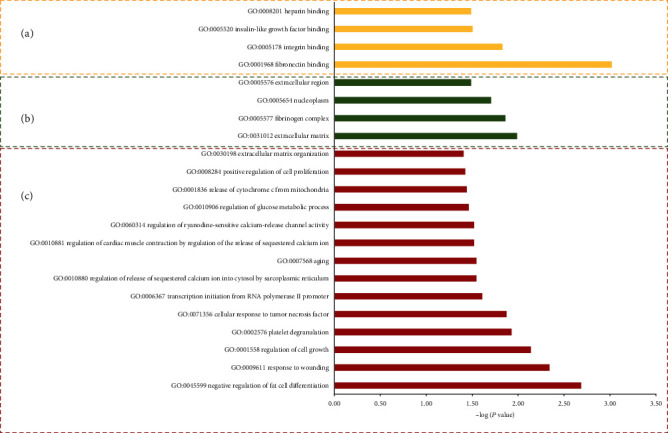
The GO term enrichment analysis on 33 selected DEGs in GC. (a) Thin yellow bars represent molecular function terms. (b) Green bars represent cell component terms. (c) Red bars represent biological processes.

The GO term enrichment analysis on 33 selected DEGs in GC. (a) Thin yellow bars represent molecular function terms. (b) Green bars represent cell component terms. (c) Red bars represent biological processes.