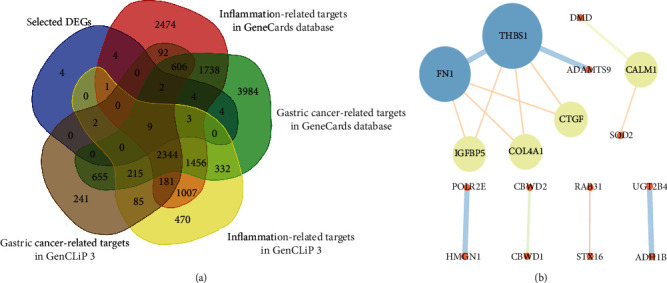
Figure 5.

The identification of inflammation-related targets in GC by Venn diagram and PPI analysis: (a) Venn diagrams of the inflammation-related targets between the selected DEGs and the integrated GC-/inflammation-related targets in the GeneCards and GenCLiP 3 database; (b) the PPI network of 33 coexisting DEGs. Nodes represent genes, with the degree shown by the size and bright colors, and edges represent interactions between two genes, with the combined scores displayed by the size and bright colors.
