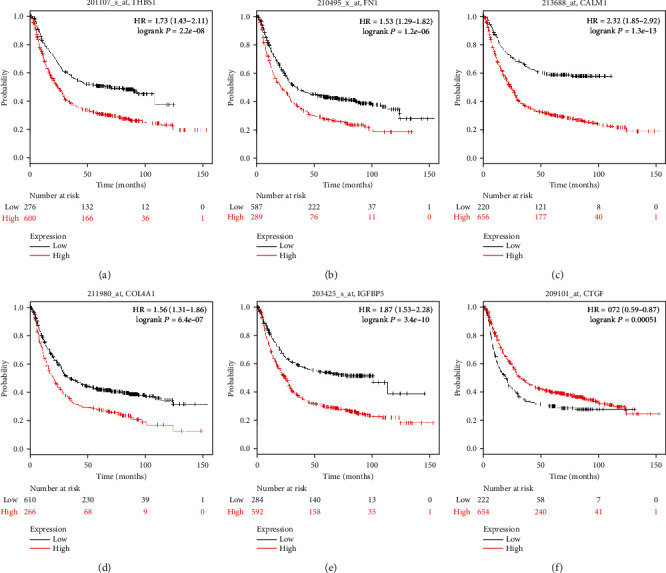
Figure 9.

Prognostic curve for the six hub genes. The prognostic significance of the hub genes in patients with GC determined using the Kaplan-Meier plotter. Affymetrix IDs (a) 201107_s_at, (b) 210495_x_at, (c) 213688_at, (d) 211980_at, (e) 203425_s_at, and (f) 209101_at represent THBS1, FN1, CALM1, COL4A1, IGFBP5, and CTGF, respectively. Red lines represent patients with high gene expression, and black lines represent patients with low gene expression.
