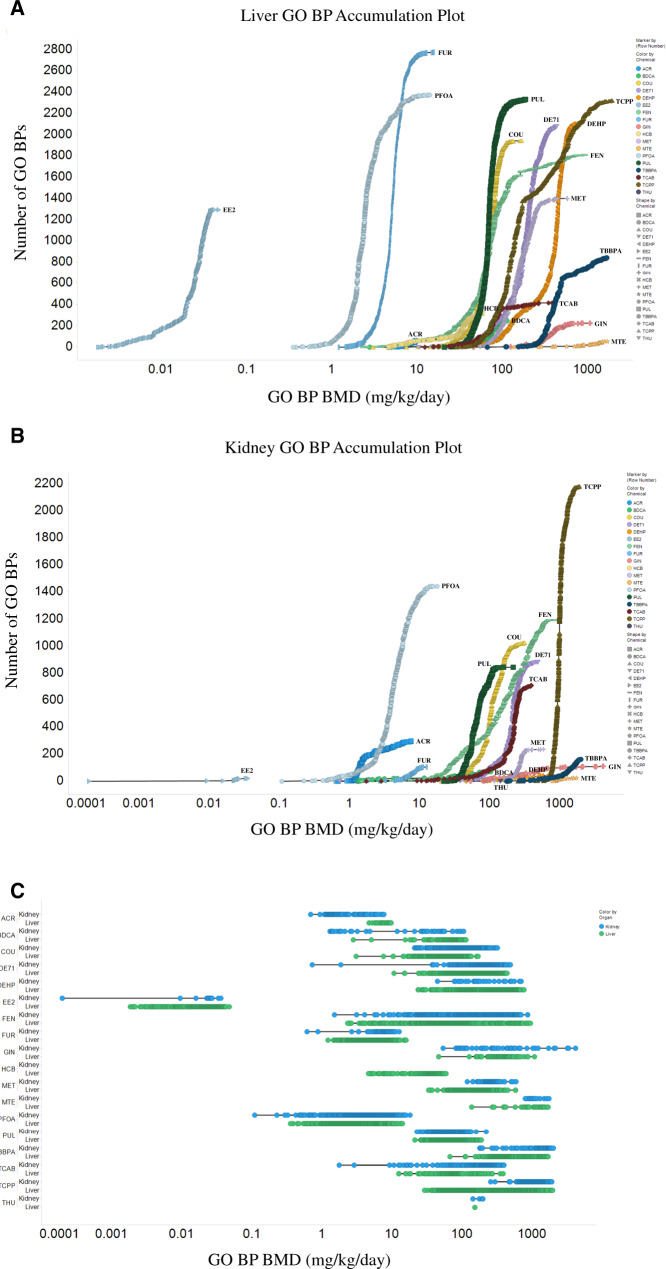
Figure 1.
Gene set (Gene Ontology Biological Process, GO BP) accumulation plots for liver (A) and kidney (B) from the 5-day assays in male rats (THU cannot be seen on the plot in A due to only 1 active GO BP for liver, and HCB is not on the plot in B due to no active GO BPs for kidney). Line plots for gene sets (GO BPs) in liver and kidney are shown in C. Each point represents a single active GO BP. All benchmark doses (BMDs) are in mg/kg/day.

