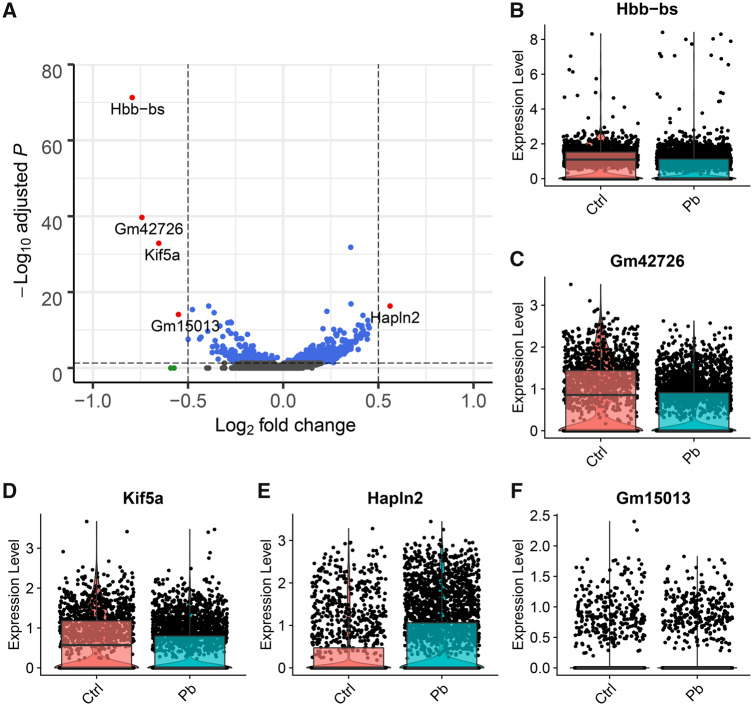
Figure 2.
Across all cells measured, genes differentially expressed in the mouse hippocampus at 5 months of age following perinatal Pb exposure. Volcano plot of the log(fold change) difference in expression between Pb exposed and control versus the −log10(FDR q value) for the test statistic. Each point represents a gene. Genes reaching q value < 0.05 are blue, genes reaching log(fold change) > ± 0.5 are green, and genes reaching both thresholds are red (A). Violin plots showing per cell gene expression in Pb-exposed animals versus controls for Hbb-bs (B) Gm42726 (C), Kif5a (D), Hapln2 (E), and Gm15013 (F). FDR: false discovery rate.

