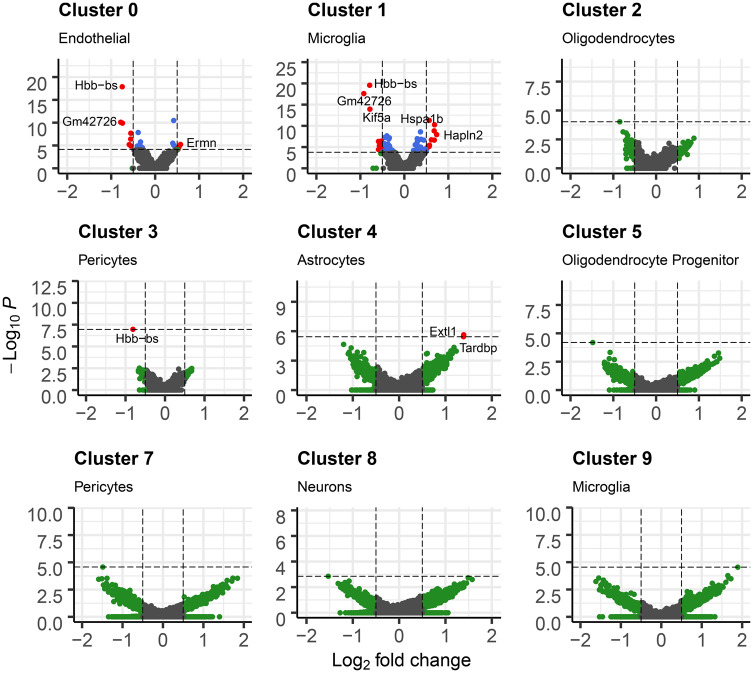
Figure 4.
Multipanel volcano plot for each cell cluster representing the associations between Pb treatment and gene expression. Cutoff for log fold change is 0.05. p value cutoffs were set at maximum p value if no genes had FDR < 0.05, or at largest p value that had FDR < 0.05. Points are gray if genes do not meet log fold change or p value cutoff, green if they only meet p value cutoff, blue if genes only meet log fold change cutoff, and red if genes meet both log fold change and p value cutoff.

