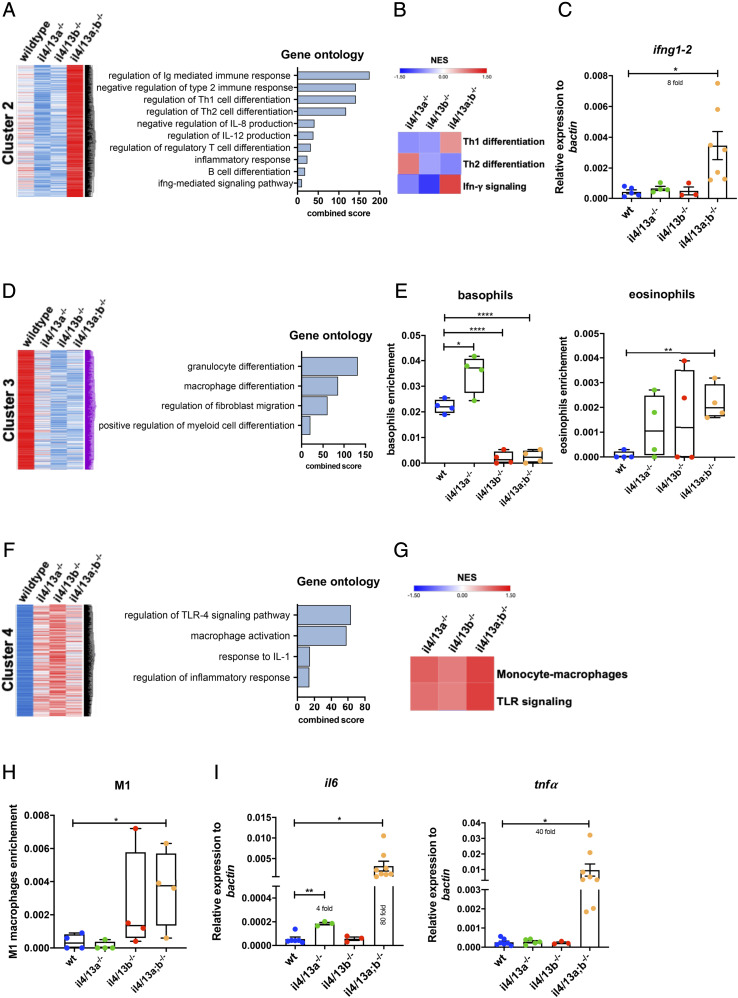
FIGURE 3.
Transcriptome analysis of il4/13a−/−, il4/13b−/−, and il4/13a;b−/− gills. (A, D, and F) Clustering of differentially expressed genes identified in gills harvested from 6-mo-old fish. Blue indicates low expression, red indicates high expression, and white indicates unchanged expression. Bar graphs show significantly enriched ontologies for each cluster of genes. (B and G) Heatmap of NES for the indicated gene sets generated by GSEA in mutant gills compared with wildtype gills. (C and I) qPCR analysis showing transcript levels of ifng1–2, il6, and tnfa in wildtype and mutant gills. Gene expression was normalized to the expression of β−actin. Error bars represent SEM; n > 3, *p < 0.05, **p < 0.01, ****p < 0.0001. (E and H) Enrichment score of basophils, eosinophils, and M1 macrophages obtained by xCell analysis.

