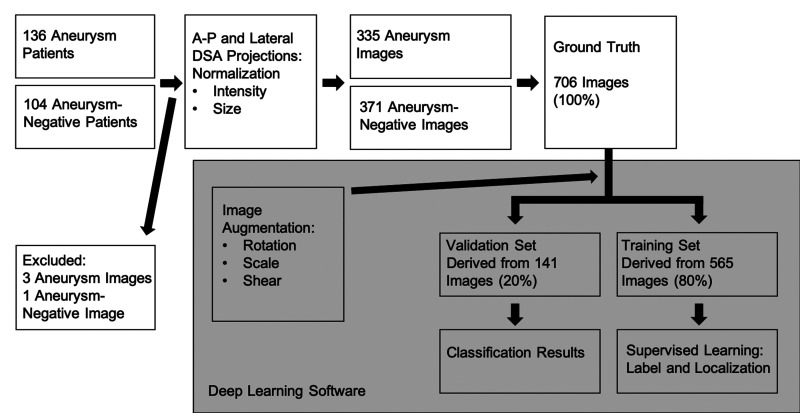
Figure 1.
Flowchart of image processing from patient cohort to deep learning classification results. The grey rectangle signifies steps performed by the deep learning software beginning with image augmentation to splitting the data into validation and training sets for supervised learning. DSA: digital subtraction angiography; A-P: anteroposterior.

