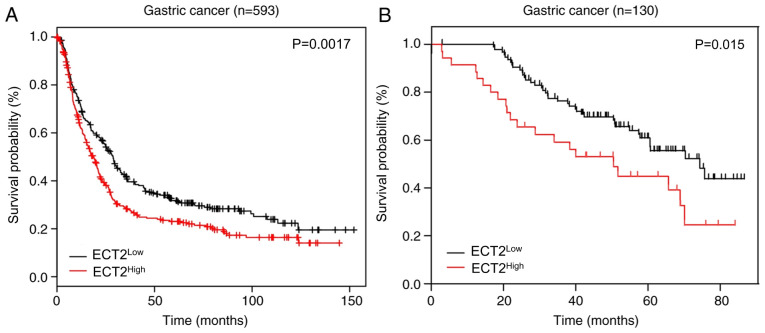
Figure 3.
ECT2 upregulation predicts poor clinical outcome. (A) The Kaplan-Meier Plotter database was used to assess the difference in overall survival time between high and low ECT2 expression groups. (B) Difference in overall survival time between high and low ECT2 expression levels in gastric tissues. ECT2, epithelial cell transforming 2.

