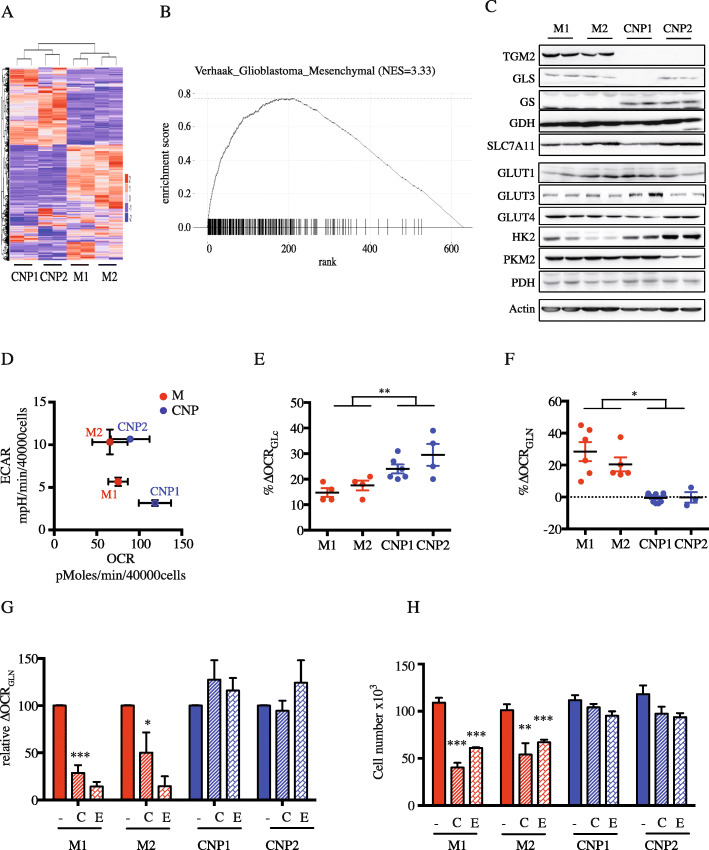
Fig. 1.
Human primary culture characterization. a Heat map of unsupervised hierarchical classification. b Molecular subtypes assigned by GSEA. c Protein abundance of glycolytic and glutaminolytic enzymes: transglutaminase 2 (TGM2), glutaminase (GLS), glutamine synthetase (GS), glutamate dehydrogenase (GDH), Cystine/glutamate antiporter XCT/SLC7A11, glucose transporter (GLUT), hexokinase 2 (HK2), isoform M2 of pyruvate kinase (PKM2), and pyruvate dehydrogenase (PDH). Actin was used as a loading control. d Global metabolism using the Seahorse technology. OCR (oxygen consumption rate) and ECAR (extracellular acidification rate) were measured (n > 3 for each primary cultures). e, f Mitochondrial respiration rate based on glutamine (∆OCRGLN; e) or glucose (∆OCRGLC; f). Results are presented as mean ± SEM, n = 5 for each primary cultures. *p < 0.05; **p < 0.01. g Inhibition of mitochondrial respiration rate based on glutamine 5 h after addition of glutaminase and GDH inhibitors, CB839 (C) and EGCG (E), respectively. Results are presented as mean ± SEM, n = 3 for each primary cultures. *p < 0.05; ***p < 0.001. h Proliferation of primary GBM cells after 72 h in the presence of glutaminase and GDH inhibitors, CB839 (C) and EGCG (E), respectively. Results are presented as mean ± SEM, n = 3 for each primary cultures. **p < 0.01; ***p < 0.001

